
Stock Of The Day: Is Trump Media Stock About To Breakdown?
Stock Of The Day: Is Trump Media Stock About To Breakdown?
If understood and applied correctly, technical analysis is a study of supply and demand and market psychology. Classic chart patterns are graphical illustrations of these dynamics.
如果正確理解並應用,技術面分析是對供需和市場心理的研究。經典的圖表模式是這些動態的圖形展示。
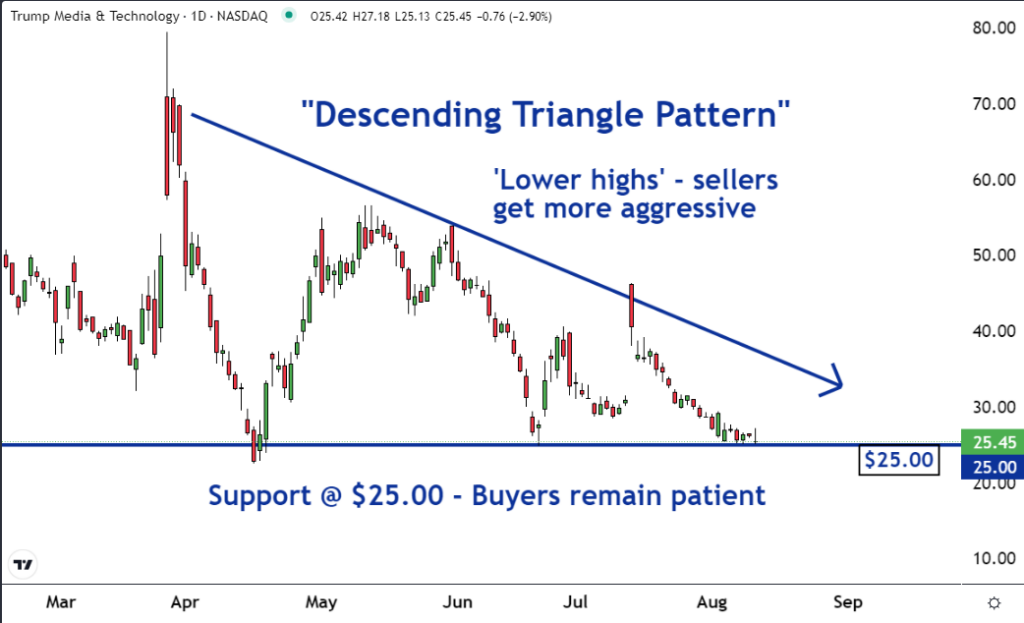
For example, a 'descending triangle' has formed on the chart of Trump Media & Technology Group Corp. (NASDAQ:DJT). This pattern typically has bearish implications and suggests that the price is about to move lower. This is why our team of expert traders and technical analysts have made it our 'Stock of the Day'.
例如,唐納德·特朗普媒體與科技集團股份有限公司的圖表上形成了一個「下降三角形」模式 (NASDAQ:DJT)。這種模式通常意味着看淡的影響,暗示價格即將下跌。這就是爲什麼我們的專家交易員和技術分析師把它作爲我們每日的熱點股票的原因。
A descending triangle shows that as time passes, buyers remain patient while sellers become increasingly aggressive. Regardless of the market, aggressive sellers and complacent or patient buyers can set the stage for a move South.
一個下降三角形模式顯示隨着時間的推移,買家保持耐心,而賣家變得越來越有侵略性。無論是哪個市場,有侵略性的賣家和自滿或耐心的買家都會爲南移打下基礎。
As you can see on the chart, the $25 level has been support for DJT since April. Each time the shares dropped to this price, buyers put a floor under it. This means that these buyers were willing to be patient and let the sellers come to them.
正如您在圖表上看到的那樣,自四月份以來,$25的水平一直是DJT的支撐。每次股票下跌到這個價格時,買家會在下方放置一層支撐。這意味着這些買家願意耐心等待賣家向他們出售。
Read Also: What's Going On With Trump Media Stock On Monday?
閱讀更多:特朗普媒體股票週一怎麼了?
The horizontal support line is an illustration of patient or complacent buyers.
水平支撐線是對耐心或自滿買家的說明。
As you can also see on the chart, the resistance line has been declining or descending since late March. This line illustrates a series of 'lower highs'.
正如您在圖表上也可以看到的那樣,自三月底以來,阻力線一直在下降或下降。這條線展示了一系列「低高點」。
It shows that as time has passed, the sellers have become increasingly aggressive. They have been willing to accept successively lower prices for their shares.
它顯示隨着時間的推移,賣家變得越來越有侵略性。他們願意接受越來越低的價格來出售他們的股票。
The descending resistance line is an illustration of aggressive sellers
下降的阻力線是對有侵略性的賣家的說明。
When a stock reaches a support level, as DJT has done, traders and investors become curious as to whether the support will break and the shares will head lower, or if the support will hold and the shares will reverse and rally.
當股票到達支撐水平時,如DJT所做的那樣,交易員和投資者變得好奇,支撐是否會破裂,股票是否會下跌,還是支撐會保持,股票會反轉和上漲。
When there is a descending triangle pattern or series of lower highs in a trend before a stock reaches support, there is a good chance that the support breaks. The aggressive sellers will overpower the patient buyers. This will force the price lower.
當股票到達支撐之前的下降三角形模式或一系列低高點趨勢時,有很大的機會支撐會破裂。有侵略性的賣家將壓倒有耐心的買家。這將迫使價格下降。
There is a good chance that shares of DJT are about to enter a new downtrend.
DJt的股票有很大的機會進入新的下跌趨勢。
- Markets Experience Best And Worst Days Since 2022: What's Next In Wall Street's Rollercoaster Ride?
- 自2022年以來,市場經歷了最好和最差的日子:華爾街過山車之旅的下一個是什麼?
Photo: Shutterstock
Photo: shutterstock