
Investors in EnerSys (NYSE:ENS) Have Seen Favorable Returns of 85% Over the Past Five Years
Investors in EnerSys (NYSE:ENS) Have Seen Favorable Returns of 85% Over the Past Five Years
 Over half a decade, EnerSys managed to grow its earnings per share at 12% a year. That makes the EPS growth particularly close to the yearly share price growth of 12%. That suggests that the market sentiment around the company hasn't changed much over that time. Indeed, it would appear the share price is reacting to the EPS.
 EnerSys (NYSE:ENS) shareholders have seen the share price descend 10% over the month. On the bright side the share price is up over the last half decade. In that time, it is up 76%, which isn't bad, but is below the market return of 105%.
艾諾斯(NYSE:ENS)股東在一個月內看到股價下跌了10%。 好消息是股價在過去的五年裏上漲了。 在這段時間內,上漲了76%,這不錯,但低於市場回報率的105%。
So let's investigate and see if the longer term performance of the company has been in line with the underlying business' progress.
那麼,讓我們調查一下並查看公司的長期表現是否符合基本業務的進展。
To paraphrase Benjamin Graham: Over the short term the market is a voting machine, but over the long term it's a weighing machine. One imperfect but simple way to consider how the market perception of a company has shifted is to compare the change in the earnings per share (EPS) with the share price movement.
爲了概述本傑明·格雷厄姆(Benjamin Graham)的話:短期內,市場是一臺投票機,但長期來看,它是一臺衡重機。思考一家公司的市場感知如何轉變的一種不完美但簡單的方法是將每股收益(EPS)變化與股價變動進行比較。
Over half a decade, EnerSys managed to grow its earnings per share at 12% a year. That makes the EPS growth particularly close to the yearly share price growth of 12%. That suggests that the market sentiment around the company hasn't changed much over that time. Indeed, it would appear the share price is reacting to the EPS.
在過去的五年中,艾諾斯每股收益以12%的年增長率增長。 這使得每股收益增長特別接近每年股價的增長率12%。 這表明市場對公司的情緒在那段時間內沒有太大變化。 的確,股價似乎是對每股收益的反應。
The company's earnings per share (over time) is depicted in the image below (click to see the exact numbers).
該公司的每股收益(隨時間的推移)如下圖所示(單擊可查看確切數字)。
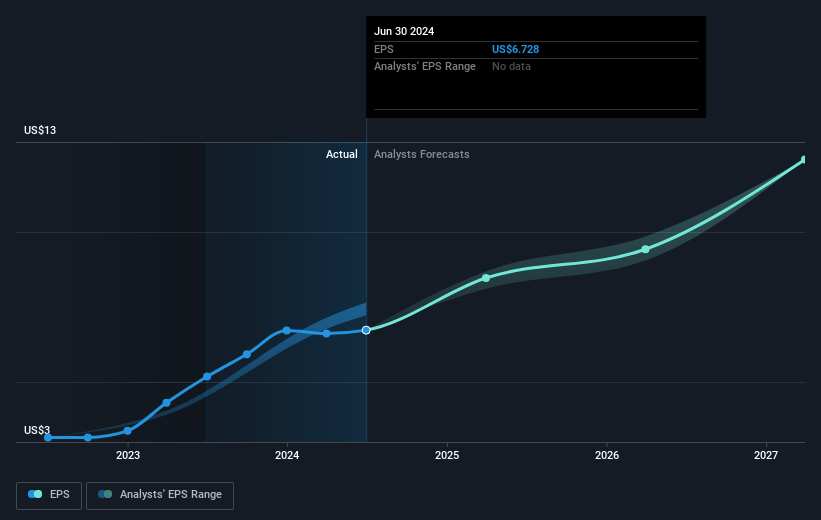
We know that EnerSys has improved its bottom line lately, but is it going to grow revenue? This free report showing analyst revenue forecasts should help you figure out if the EPS growth can be sustained.
我們知道EnerSys公司近期改善了其底線,但是其營業收入是否會增長呢?這份顯示分析師預測營業收入的免費報告應該能幫助您判斷EPS增長是否可持續。
What About Dividends?
那麼分紅怎麼樣呢?
It is important to consider the total shareholder return, as well as the share price return, for any given stock. The TSR is a return calculation that accounts for the value of cash dividends (assuming that any dividend received was reinvested) and the calculated value of any discounted capital raisings and spin-offs. So for companies that pay a generous dividend, the TSR is often a lot higher than the share price return. We note that for EnerSys the TSR over the last 5 years was 85%, which is better than the share price return mentioned above. This is largely a result of its dividend payments!
對於任何給定的股票,考慮總股東回報和股價回報同樣重要。TSR是一個考慮現金分紅價值(假設任何股息都被再投資)以及任何折現的增資和剝離計算值的回報計算方法。因此,對於支付豐厚股息的公司來說,TSR往往比股價回報高得多。我們注意到,對於EnerSys來說,過去5年的TSR爲85%,這比上面提到的股價回報要好。這在很大程度上是其紅利支付的結果!
A Different Perspective
不同的觀點
EnerSys shareholders are down 2.9% for the year (even including dividends), but the market itself is up 28%. Even the share prices of good stocks drop sometimes, but we want to see improvements in the fundamental metrics of a business, before getting too interested. On the bright side, long term shareholders have made money, with a gain of 13% per year over half a decade. It could be that the recent sell-off is an opportunity, so it may be worth checking the fundamental data for signs of a long term growth trend. Is EnerSys cheap compared to other companies? These 3 valuation measures might help you decide.
EnerSys的股東今年結束時下跌了2.9%(包括股息),但市場本身上漲了28%。即使好股票的股價有時也會下跌,但在我們產生濃厚興趣之前,我們希望看到企業基本指標的改善。值得一提的是,長期的股東賺錢了,過去五年年均增長13%。最近的拋售可能是一個機會,因此值得查看基本數據,以找到長期增長趨勢的跡象。相較於其他公司來說,EnerSys是否便宜?這三個估值指標可能對您做出決策有所幫助。
We will like EnerSys better if we see some big insider buys. While we wait, check out this free list of undervalued stocks (mostly small caps) with considerable, recent, insider buying.
如果我們看到一些內部人士大規模購買股票,我們會更喜歡艾諾斯。在等待的時候,可以查看這份免費的低估股票名單(主要是小市值股票),其中包括相當多最近的內部購買。
Please note, the market returns quoted in this article reflect the market weighted average returns of stocks that currently trade on American exchanges.
請注意,本文所引述的市場回報反映了目前在美國交易所上市的股票的市場加權平均回報。
Have feedback on this article? Concerned about the content? Get in touch with us directly. Alternatively, email editorial-team (at) simplywallst.com.
This article by Simply Wall St is general in nature. We provide commentary based on historical data and analyst forecasts only using an unbiased methodology and our articles are not intended to be financial advice. It does not constitute a recommendation to buy or sell any stock, and does not take account of your objectives, or your financial situation. We aim to bring you long-term focused analysis driven by fundamental data. Note that our analysis may not factor in the latest price-sensitive company announcements or qualitative material. Simply Wall St has no position in any stocks mentioned.
對本文有任何反饋?對內容有任何疑慮?請直接與我們聯繫。或者,發送電子郵件至editorial-team@simplywallst.com。
這篇文章是Simply Wall St的一般性文章。我們根據歷史數據和分析師預測提供評論,只使用公正的方法論,我們的文章並不意味着提供任何金融建議。文章不構成買賣任何股票的建議,也不考慮您的目標或您的財務狀況。我們的目標是帶給您基本數據驅動的長期關注分析。請注意,我們的分析可能不考慮最新的價格敏感公司公告或定性材料。Simply Wall St沒有任何股票頭寸。