
Johnson & Johnson's Golden Cross: A Bullish Prescription For Investors?
Johnson & Johnson's Golden Cross: A Bullish Prescription For Investors?
 For Johnson & Johnson, the stock's 50-day simple moving average (SMA) of $155.36 has crossed above the 200-day SMA of $154.46, signaling strong upward momentum.
Johnson & Johnson (NYSE:JNJ) has just made a significant technical move, achieving a Golden Cross.
強生公司(紐交所:JNJ)剛剛進行了重大的技術動作,實現了一個金叉。
This technical pattern occurs when a stock's short-term moving average crosses above its long-term moving average, indicating a potential shift from a bearish to a bullish trend.
這種技術模式發生在股票的短期移動平均線上穿過長期移動平均線時,表明可能從看淡趨勢轉變爲看好趨勢。
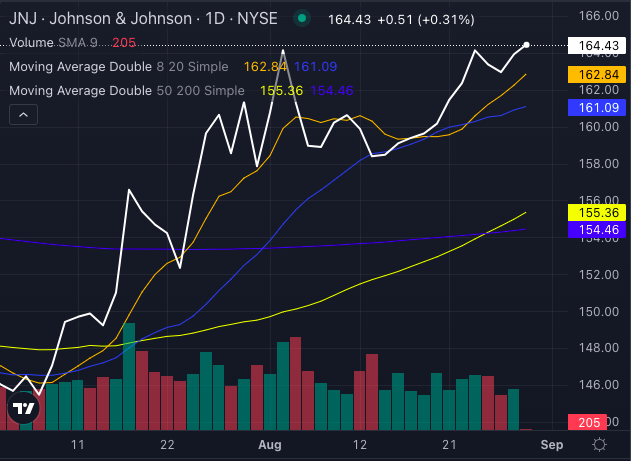
Chart created using Benzinga Pro
使用Benzinga Pro創建的圖表
For Johnson & Johnson, the stock's 50-day simple moving average (SMA) of $155.36 has crossed above the 200-day SMA of $154.46, signaling strong upward momentum.
對於強生公司而言,股票的50天簡單移動平均線(SMA)爲155.36美元,已經超過了200天SMA的154.46美元,表明強勁的上行勢頭。
Golden Cross: What It Means For Johnson & Johnson Investors
金叉:對強生公司投資者意味着什麼
A Golden Cross is considered a bullish indicator, suggesting that Johnson & Johnson stock could be entering a period of sustained upward momentum.
金叉被認爲是一個看好的信號,暗示強生公司股票可能正在進入持續上行勢頭的時期。
The stock currently trades at $164.43, comfortably above its eight-day SMA of $162.84, 20-day SMA of $161.09 and 50-day SMA of $155.36. These signals collectively point towards strong buying pressure and a bullish trend.
該股目前交易於164.43美元,遠高於其8日SMA的162.84美元、20日SMA的161.09美元和50日SMA的155.36美元。這些信號共同指向強勁的買壓和看好趨勢。
Short-Term Strength: Moving Averages Confirm the Trend
近期強勢:移動平均線確認趨勢
- 8-Day SMA: With Johnson & Johnson stock trading at $164.43 against the eight-day SMA of $162.84, the short-term outlook remains bullish.
- 20-Day SMA: The 20-day SMA stands at $161.09, also below the current price, reinforcing the bullish sentiment.
- 50-Day SMA: Johnson & Johnson stock's 50-day SMA of $155.36 further supports the bullish narrative, as the stock remains well above this level.
- 200-Day SMA: The long-term trend remains bullish as the current price far exceeds the 200-day SMA of $154.46.
- 8日簡單移動平均線(SMA):與強生公司股票交易價164.43美元相比,8日SMA爲162.84美元,短期展望依然看好。
- 20日簡單移動平均線(SMA):20日SMA爲161.09美元,同樣低於當前價格,增強看多情緒。
- 50日簡單移動平均線(SMA):強生公司股票的50日SMA爲155.36美元,進一步支持看多論調,因爲股票價格遠高於該水平。
- 200日簡單移動平均線(SMA):由於當前價格遠超過154.46美元的200日SMA,長期趨勢仍然看好。
Read Also: Johnson & Johnson Seeks FDA Approval For Muscle Weakness Drug And Gears Up Showdown With Argenx and UCB
閱讀更多:強生公司尋求FDA批准肌無力藥物,並準備與Argenx和UCB展開較量
Fundamental Backing: Positive Catalysts Ahead
基本面支持:未來有積極因素
Johnson & Johnson's recent submission of a Biologics License Application (BLA) to the FDA for nipocalimab, aimed at treating generalized myasthenia gravis (gMG), adds a strong fundamental tailwind to the stock.
強生公司最近向FDA提交了一份生物製品許可申請(BLA),用於治療全身性重症肌無力(gMG),爲股票增添了強大的基本面推動力。
The company's ongoing efforts to expand its oncology pipeline, combined with strategic acquisitions like V-Wave Ltd., are set to bolster its growth prospects.
該公司不斷努力拓展其腫瘤學產品線,再加上V-Wave Ltd.等戰略性收購,將提升其增長前景。
Bullish Signals For Johnson & Johnson
關於強生的看好信號
With the Golden Cross in play and a series of fundamental catalysts on the horizon, Johnson & Johnson's stock appears poised for continued strength.
黃金交叉正在發揮作用,未來還有一系列基本面的催化劑,強生的股票似乎有望繼續保持強勢。
The bullish technical indicators and the company's strategic initiatives position Johnson & Johnson as a compelling opportunity for investors looking to capitalize on its upward momentum.
看多的技術指標和公司的戰略舉措使強生成爲投資者尋求利用其上升勢頭的一個引人注目的機會。
- Johnson & Johnson Aims New Policy For Hospital Payments Under 340B Drug Discount Program Related To Its Flagship Blood Thinner And Arthritis Drugs
- 強生公司旨在醫院支付3400億藥物折扣計劃下的新策略,與其旗艦血液稀釋劑和關節炎藥物有關
Image: Shutterstock
圖片:shutterstock