
Investors in Guangdong Ganhua Science & IndustryLtd (SZSE:000576) From Three Years Ago Are Still Down 49%, Even After 15% Gain This Past Week
Investors in Guangdong Ganhua Science & IndustryLtd (SZSE:000576) From Three Years Ago Are Still Down 49%, Even After 15% Gain This Past Week
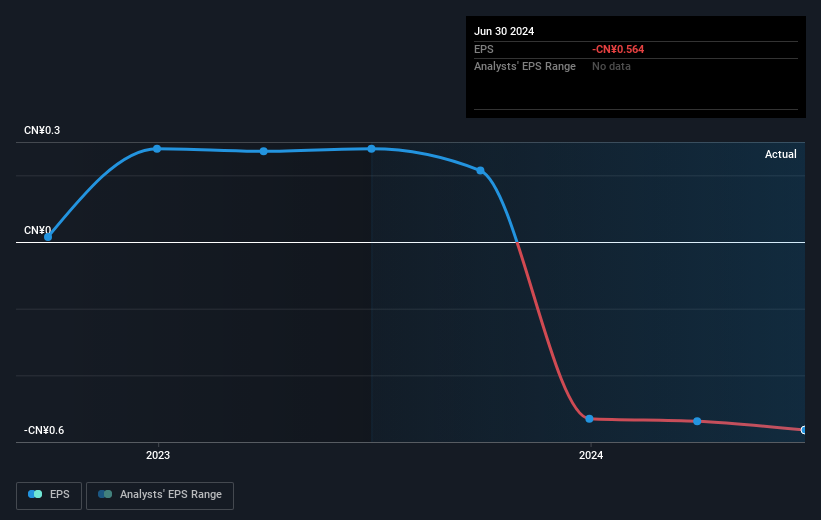
 Guangdong Ganhua Science & IndustryLtd saw its share price decline over the three years in which its EPS also dropped, falling to a loss. Since the company has fallen to a loss making position, it's hard to compare the change in EPS with the share price change. However, we can say we'd expect to see a falling share price in this scenario.
 Guangdong Ganhua Science & Industry Co.,Ltd. (SZSE:000576) shareholders should be happy to see the share price up 16% in the last month. But that cannot eclipse the less-than-impressive returns over the last three years. In fact, the share price is down 49% in the last three years, falling well short of the market return.
廣東贛華科技產業股份有限公司(SZSE:000576)的股東應該會高興看到股價在過去一個月內上漲了16%。 但這並不能掏空過去三年中不太理想的回報率。 實際上,在過去三年中,股價下跌了49%,遠遠低於市場回報。
While the stock has risen 15% in the past week but long term shareholders are still in the red, let's see what the fundamentals can tell us.
儘管股票上漲了15%,但遠期股東仍處於虧損狀態,讓我們看看基本面能夠告訴我們什麼。
In his essay The Superinvestors of Graham-and-Doddsville Warren Buffett described how share prices do not always rationally reflect the value of a business. One flawed but reasonable way to assess how sentiment around a company has changed is to compare the earnings per share (EPS) with the share price.
在他的文章《格雷厄姆-多德斯維爾的超級投資人》中,禾倫·巴菲特描述了股票價格並不總是理性地反映公司價值的情況。一種有缺陷但合理的評估公司情緒如何變化的方法是將每股收益(EPS)與股票價格進行比較。
Guangdong Ganhua Science & IndustryLtd saw its share price decline over the three years in which its EPS also dropped, falling to a loss. Since the company has fallen to a loss making position, it's hard to compare the change in EPS with the share price change. However, we can say we'd expect to see a falling share price in this scenario.
廣東贛華科技產業有限公司看到其股價在過去三年中下跌,同時其每股收益也下降,陷入虧損。 由於公司陷入虧損位置,很難將每股收益的變化與股價變化相比較。 然而,我們可以說在這種情況下會預計看到股價下跌。
The company's earnings per share (over time) is depicted in the image below (click to see the exact numbers).
該公司的每股收益(隨時間的推移)如下圖所示(單擊可查看確切數字)。
Dive deeper into Guangdong Ganhua Science & IndustryLtd's key metrics by checking this interactive graph of Guangdong Ganhua Science & IndustryLtd's earnings, revenue and cash flow.
通過查看廣東贛華科技和行業板塊的收入、營業收入和現金流量的互動圖表,深入了解廣東贛華科技和行業板塊的關鍵指標。
A Different Perspective
不同的觀點
While the broader market lost about 10% in the twelve months, Guangdong Ganhua Science & IndustryLtd shareholders did even worse, losing 36%. However, it could simply be that the share price has been impacted by broader market jitters. It might be worth keeping an eye on the fundamentals, in case there's a good opportunity. Regrettably, last year's performance caps off a bad run, with the shareholders facing a total loss of 4% per year over five years. Generally speaking long term share price weakness can be a bad sign, though contrarian investors might want to research the stock in hope of a turnaround. I find it very interesting to look at share price over the long term as a proxy for business performance. But to truly gain insight, we need to consider other information, too. For example, we've discovered 1 warning sign for Guangdong Ganhua Science & IndustryLtd that you should be aware of before investing here.
儘管整體市場在過去十二個月裏大約下跌了10%,但廣東贛華科技和行業板塊的股東表現得更糟,損失了36%。然而,這可能只是股價受到整體市場恐慌的影響。值得留意基本面,以防有好的機會。遺憾的是,去年的表現爲一段不佳的走勢畫上了句號,股東面臨着每年5年總虧損4%。一般來說,長期股價走弱可能是一個不好的信號,儘管逆向投資者可能希望研究該股票以期望逆轉。我發現長期觀察股價作爲業務績效的一種代理是非常有趣的。但要真正獲得洞察,我們還需要考慮其他信息。例如,我們發現了1個對廣東贛華科技和行業板塊提出的警告標誌,你在投資之前應該注意。
If you like to buy stocks alongside management, then you might just love this free list of companies. (Hint: many of them are unnoticed AND have attractive valuation).
如果您喜歡與管理層一起購買股票,那麼您可能會喜歡這個公司的免費列表。 (提示:其中許多公司不爲人注意且具有吸引力的估值。)
Please note, the market returns quoted in this article reflect the market weighted average returns of stocks that currently trade on Chinese exchanges.
請注意,本文引用的市場回報反映了目前在中國交易所上市的股票的市場加權平均回報。
Have feedback on this article? Concerned about the content? Get in touch with us directly. Alternatively, email editorial-team (at) simplywallst.com.
This article by Simply Wall St is general in nature. We provide commentary based on historical data and analyst forecasts only using an unbiased methodology and our articles are not intended to be financial advice. It does not constitute a recommendation to buy or sell any stock, and does not take account of your objectives, or your financial situation. We aim to bring you long-term focused analysis driven by fundamental data. Note that our analysis may not factor in the latest price-sensitive company announcements or qualitative material. Simply Wall St has no position in any stocks mentioned.
對本文有任何反饋?對內容有任何疑慮?請直接與我們聯繫。或者,發送電子郵件至editorial-team@simplywallst.com。
這篇文章是Simply Wall St的一般性文章。我們根據歷史數據和分析師預測提供評論,只使用公正的方法論,我們的文章並不意味着提供任何金融建議。文章不構成買賣任何股票的建議,也不考慮您的目標或您的財務狀況。我們的目標是帶給您基本數據驅動的長期關注分析。請注意,我們的分析可能不考慮最新的價格敏感公司公告或定性材料。Simply Wall St沒有任何股票頭寸。
熱門市場機會
熱門討論

熱門討論
