The SPDR S&P 500 (NYSE:SPY) closed slightly higher on Monday on far below-average volume ahead of the Fourth of July holiday.
The stock market ETF printed an inside bar pattern on the daily chart, which leans bullish for continuation, although a bearish quadruple top pattern could cause resistance near the $444 level to hold strong.
More experienced traders who wish to play the SPY either bullishly or bearishly may choose to do so through one of two Direxion ETFs. Bullish traders can enter a short-term position in Direxion Daily S&P 500 Bull 3X Shares (NYSE: SPXL) and bearish traders can trade the inverse ETF, Direxion Daily S&P 500 Bear 3X Shares (NYSE:SPXS).
See Also: Bitcoin Consolidates Under Heavy Resistance, Prints Bullish Pattern: A Look At The Technicals
The ETF: SPXL and SPXS are triple leveraged funds that track the movement of the SPY, seeking a return of 300% or negative 300% on the return of the benchmark index over a single day.
It should be noted that leveraged ETFs are meant to be used as a trading vehicle as opposed to long-term investments.
Want direct analysis? Find me in the BZ Pro lounge! Click here for a free trial.
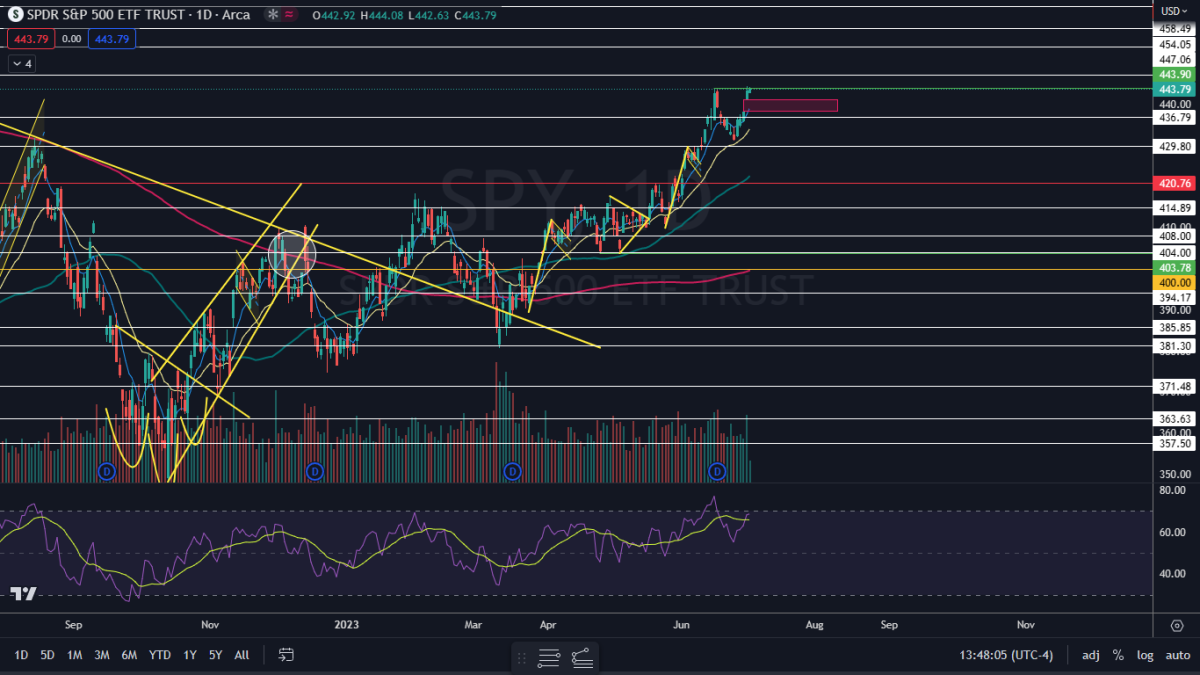
The SPY Chart: The SPY's inside bar pattern leans bullish because the ETF was trading higher before forming it and because Monday's trading range took place near the top of Friday's range. Bullish traders want to see the ETF break up from the mother bar on higher-than-average volume on Wednesday, which will confirm the pattern was recognized.
Bearish traders want to see big bearish volume come in near $444 again on Wednesday, which could suggest the quadruple top pattern is dominant or it could cause a quintuple top pattern to print. If that area continues to act as strong resistance, sideways consolidation or a retracement lower are likely.
The sideways consolidation that the SPY has been trading in over longer time frames has allowed the ETF's relative strength index to drop from overbought territory to a more comfortable 68%. If the SPY breaks bullishly from the inside bar pattern, the RSI will head above 70% again, which could indicate a pull back is in the cards for later in the week.
The SPY has resistance above at $443.90 and $447.06 and support below at $436.79 and $429.80.
 Read Next: Gold Miners Trading At Bargain Price To Gold: Is GDX The Buy Opportunity For The Remainder Of 2023?
Photo via Shutterstock.
の SPDR S&P 500 ETF (NYSE: SPY) は、7月4日の祝日に先立ち、平均をはるかに下回る出来高で、月曜日にわずかに高値で取引を終えました。
株式市場のETFは日足チャートに内側のバーパターンを印刷しました。これは強気の継続に傾いていますが、弱気の4倍のトップパターンでは、444ドルの水準近くのレジスタンスが堅調に推移する可能性があります。
SPYを強気または弱気でプレイしたい経験豊富なトレーダーは、2つのDirexion ETFのいずれかを通じてプレイすることを選択できます。強気のトレーダーは、短期ポジションにポジションを組むことができます Direxion デイリー S&P 500 ブル3倍 ETF (NYSE: SPXL) と弱気トレーダーはインバースETFを取引できます。 Direxion デイリー S&P 500 ベア3倍 ETF (ニューヨーク証券取引所:SPCS)。
こちらもご覧ください:ビットコインは激しいレジスタンスの下で統合され、強気パターンを示す:テクニカル分析を見てみましょう
ETF: SPXLとSPXSは、SPYの動きを追跡するトリプルレバレッジファンドで、1日のベンチマーク指数のリターンで300%またはマイナス300%のリターンを目指しています。
レバレッジETFは、長期投資ではなく取引手段として使用することを目的としていることに注意してください。
直接分析したいですか?BZ Proラウンジで私を見つけてください!無料試用版については、ここをクリックしてください。
スパイチャート: ETFは形成前に高値で取引されており、月曜日の取引レンジは金曜日のレンジのトップ近くで行われたため、SPYのインサイドバーパターンは強気に傾いています。強気なトレーダーは、ETFが水曜日に平均より高い出来高でマザーバーから外れることを望んでいます。これにより、このパターンが認識されたことが裏付けられます。
弱気トレーダーは、水曜日に大きな弱気取引量が444ドル近くになると予想しています。これは、4倍のトップパターンが優勢であるか、5倍のトップパターンが印刷される可能性があることを示唆しています。その領域が引き続き強いレジスタンスとして作用する場合、横方向の統合またはリトレースメントの下落が起こる可能性があります。
SPYが長期間にわたって横ばいで取引してきた結果、ETFの相対力指数は買われ過ぎの領域から、より快適な68%に低下しました。スパイが内側のバーパターンを突破した場合、RSIは再び70%を上回ります。これは、今週の後半に引き戻される可能性があることを示している可能性があります。
スパイのレジスタンスは443.90ドルと447.06ドルで、サポートは436.79ドルと429.80ドルで下回っています。
次を読む:バーゲン価格で金に取引する金鉱山労働者:GDXは2023年の残りの期間、買い機会でしょうか?
シャッターストック経由の写真。

