When you buy and hold a stock for the long term, you definitely want it to provide a positive return. Better yet, you'd like to see the share price move up more than the market average. But Jack Henry & Associates, Inc. (NASDAQ:JKHY) has fallen short of that second goal, with a share price rise of 32% over five years, which is below the market return. Zooming in, the stock is actually down 6.9% in the last year.
So let's assess the underlying fundamentals over the last 5 years and see if they've moved in lock-step with shareholder returns.
Check out our latest analysis for Jack Henry & Associates
While markets are a powerful pricing mechanism, share prices reflect investor sentiment, not just underlying business performance. One way to examine how market sentiment has changed over time is to look at the interaction between a company's share price and its earnings per share (EPS).
Over half a decade, Jack Henry & Associates managed to grow its earnings per share at 0.1% a year. This EPS growth is slower than the share price growth of 6% per year, over the same period. So it's fair to assume the market has a higher opinion of the business than it did five years ago. That's not necessarily surprising considering the five-year track record of earnings growth.
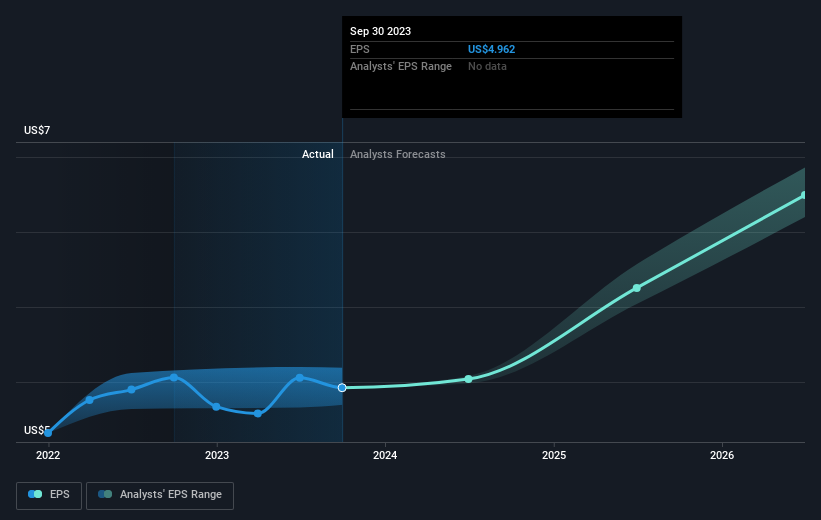
You can see below how EPS has changed over time (discover the exact values by clicking on the image).
NasdaqGS:JKHY Earnings Per Share Growth January 1st 2024
We consider it positive that insiders have made significant purchases in the last year. Having said that, most people consider earnings and revenue growth trends to be a more meaningful guide to the business. It might be well worthwhile taking a look at our free report on Jack Henry & Associates' earnings, revenue and cash flow.
What About Dividends?
When looking at investment returns, it is important to consider the difference between total shareholder return (TSR) and share price return. The TSR incorporates the value of any spin-offs or discounted capital raisings, along with any dividends, based on the assumption that the dividends are reinvested. So for companies that pay a generous dividend, the TSR is often a lot higher than the share price return. We note that for Jack Henry & Associates the TSR over the last 5 years was 40%, which is better than the share price return mentioned above. And there's no prize for guessing that the dividend payments largely explain the divergence!
A Different Perspective
Jack Henry & Associates shareholders are down 5.7% for the year (even including dividends), but the market itself is up 26%. Even the share prices of good stocks drop sometimes, but we want to see improvements in the fundamental metrics of a business, before getting too interested. Longer term investors wouldn't be so upset, since they would have made 7%, each year, over five years. It could be that the recent sell-off is an opportunity, so it may be worth checking the fundamental data for signs of a long term growth trend. Investors who like to make money usually check up on insider purchases, such as the price paid, and total amount bought. You can find out about the insider purchases of Jack Henry & Associates by clicking this link.
There are plenty of other companies that have insiders buying up shares. You probably do not want to miss this free list of growing companies that insiders are buying.
Please note, the market returns quoted in this article reflect the market weighted average returns of stocks that currently trade on American exchanges.
Have feedback on this article? Concerned about the content?Get in touch with us directly. Alternatively, email editorial-team (at) simplywallst.com. This article by Simply Wall St is general in nature. We provide commentary based on historical data and analyst forecasts only using an unbiased methodology and our articles are not intended to be financial advice. It does not constitute a recommendation to buy or sell any stock, and does not take account of your objectives, or your financial situation. We aim to bring you long-term focused analysis driven by fundamental data. Note that our analysis may not factor in the latest price-sensitive company announcements or qualitative material. Simply Wall St has no position in any stocks mentioned.
株を長期保有して、必ずポジティブなリターンを提供してもらいたいです。更に、市場平均よりも株価が上昇するのを望みます。しかし、Jack Henry & Associates, Inc.(NASDAQ:JKHY)は、シェア価格が市場リターンを下回る5年間で32%上昇しただけで、第二の目標を達成できませんでした。更に掘り下げてみると、株価は実際に過去1年間で6.9%下落しています。
5年間で、Jack Henry & Associates はEPSを年平均0.1%成長させることに成功しました。このEPS成長は、同じ期間に年平均6%の株価成長よりも遅いです。5年前に比べて、市場がビジネスに対してより高い評価を持っていると仮定するのは公正です。長期的な収益成長の5年間のトラックレコードを考えると、それは必ずしも驚くことではありません。以下のグラフで、EPSの時間とともに変化した様子を見ることができます(画像をクリックして正確な値を発見してください)。
役員が過去1年間に重要な購入を行ったことは好ましいと考えています。しかし、ほとんどの人は、収益および売上高の成長トレンドをビジネスのより意義深いガイドと考えています。Jack Henry & Associates の収益、売上高、キャッシュフローに関する無料レポートをチェックすることを強くお勧めします。
配当についてはどうでしょうか?
投資リターンを見る際に重要なのは、トータル・シェアホルダー・リターンと株価リターンの違いを考慮することです。 TSRには、分割やディスカウントの資本調達に関する値引きを含め、配当を前提にしています。慈善的な配当を支払う企業の場合、TSRは株価リターンよりもはるかに高くなることがよくあります。あなたはJack Henry & AssociatesのTSRが過去5年間で40%であることに注目する必要がありますが、これは上記の株価リターンよりも優れています。そして、配当支払いが分かれば、その差を説明することができます!トータル・シェアホルダー・リターン(TSR)株価リターンTSRは、株式配当が再投資されると仮定して、いかなるスピンオフまたは割引資本調達の価値も含みます。そのため、寛大な配当を支払う企業にとって、TSRはしばしば株価リターンよりもはるかに高くなります。Jack Henry & Associatesにおいては、過去5年間のTSRが40%で、上記の株価リターンよりも優れていることに注意してください。そして、配当支払いがその差を説明していることに違いありません!
別の視点
Jack Henry & Associates の株主は、1年間で5.7%下落しています(配当を含めています)。しかし、市場自体は26%上昇しています。優良株の株価も時には下落することがありますが、ビジネスの基本的なメトリックスの改善を確認したうえで、関心を持つ必要があります。長期的な投資家は、5年間で年間7%のリターンを出すことができたため、それほど悲観的になる必要はありません。最近の売り-off が機会である可能性があるため、長期的な成長トレンドの兆候を探る価値があるかもしれません。お金を稼ぎたいと考えている投資家は、通常、購入時の価格や購入総額などのインサイダー購入についてチェックすることができます。このリンクをクリックして、Jack Henry & Associatesのインサイダー購入について知ることができます。
オーストラリアでは、moomooの投資商品及びサービスはMoomoo Securities Australia Limitedによって提供され、オーストラリア証券投資委員会(ASIC)の管理を受けております(AFSL No. 224663)。「金融サービスガイド」、「利用規約」、「プライバシーポリシー」などの詳細は、Moomoo Securities Australia Limitedのウェブサイトhttps://www.moomoo.com/auでご確認いただけます。
オーストラリアでは、moomooの投資商品及びサービスはMoomoo Securities Australia Limitedによって提供され、オーストラリア証券投資委員会(ASIC)の管理を受けております(AFSL No. 224663)。「金融サービスガイド」、「利用規約」、「プライバシーポリシー」などの詳細は、Moomoo Securities Australia Limitedのウェブサイトhttps://www.moomoo.com/auでご確認いただけます。