

Key Insights
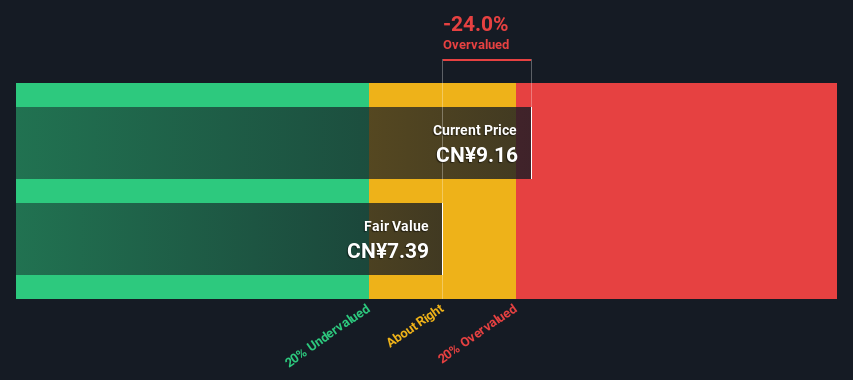
- Shuhua Sports' estimated fair value is CN¥7.39 based on 2 Stage Free Cash Flow to Equity
- Shuhua Sports is estimated to be 24% overvalued based on current share price of CN¥9.16
- Shuhua Sports' peers seem to be trading at a higher premium to fair value based onthe industry average of -250%
Today we will run through one way of estimating the intrinsic value of Shuhua Sports Co., Ltd. (SHSE:605299) by taking the forecast future cash flows of the company and discounting them back to today's value. We will take advantage of the Discounted Cash Flow (DCF) model for this purpose. There's really not all that much to it, even though it might appear quite complex.
We would caution that there are many ways of valuing a company and, like the DCF, each technique has advantages and disadvantages in certain scenarios. If you still have some burning questions about this type of valuation, take a look at the Simply Wall St analysis model.
See our latest analysis for Shuhua Sports
What's The Estimated Valuation?
 We're using the 2-stage growth model, which simply means we take in account two stages of company's growth. In the initial period the company may have a higher growth rate and the second stage is usually assumed to have a stable growth rate. In the first stage we need to estimate the cash flows to the business over the next ten years. Seeing as no analyst estimates of free cash flow are available to us, we have extrapolate the previous free cash flow (FCF) from the company's last reported value. We assume companies with shrinking free cash flow will slow their rate of shrinkage, and that companies with growing free cash flow will see their growth rate slow, over this period. We do this to reflect that growth tends to slow more in the early years than it does in later years.
A DCF is all about the idea that a dollar in the future is less valuable than a dollar today, so we need to discount the sum of these future cash flows to arrive at a present value estimate:
10-year free cash flow (FCF) forecast
| 2024 | 2025 | 2026 | 2027 | 2028 | 2029 | 2030 | 2031 | 2032 | 2033 | |
| Levered FCF (CN¥, Millions) | CN¥210.7m | CN¥214.0m | CN¥218.2m | CN¥223.2m | CN¥228.7m | CN¥234.7m | CN¥241.2m | CN¥248.0m | CN¥255.0m | CN¥262.4m |
| Growth Rate Estimate Source | Est @ 0.92% | Est @ 1.54% | Est @ 1.97% | Est @ 2.27% | Est @ 2.49% | Est @ 2.63% | Est @ 2.74% | Est @ 2.81% | Est @ 2.86% | Est @ 2.90% |
| Present Value (CN¥, Millions) Discounted @ 9.7% | CN¥192 | CN¥178 | CN¥165 | CN¥154 | CN¥144 | CN¥135 | CN¥126 | CN¥118 | CN¥111 | CN¥104 |
("Est" = FCF growth rate estimated by Simply Wall St)
Present Value of 10-year Cash Flow (PVCF) = CN¥1.4b
The second stage is also known as Terminal Value, this is the business's cash flow after the first stage. For a number of reasons a very conservative growth rate is used that cannot exceed that of a country's GDP growth. In this case we have used the 5-year average of the 10-year government bond yield (3.0%) to estimate future growth. In the same way as with the 10-year 'growth' period, we discount future cash flows to today's value, using a cost of equity of 9.7%.
Terminal Value (TV)= FCF2033 × (1 + g) ÷ (r – g) = CN¥262m× (1 + 3.0%) ÷ (9.7%– 3.0%) = CN¥4.0b
Present Value of Terminal Value (PVTV)= TV / (1 + r)10= CN¥4.0b÷ ( 1 + 9.7%)10= CN¥1.6b
The total value, or equity value, is then the sum of the present value of the future cash flows, which in this case is CN¥3.0b. To get the intrinsic value per share, we divide this by the total number of shares outstanding. Relative to the current share price of CN¥9.2, the company appears slightly overvalued at the time of writing. Valuations are imprecise instruments though, rather like a telescope - move a few degrees and end up in a different galaxy. Do keep this in mind.
The Assumptions
The calculation above is very dependent on two assumptions. The first is the discount rate and the other is the cash flows. If you don't agree with these result, have a go at the calculation yourself and play with the assumptions. The DCF also does not consider the possible cyclicality of an industry, or a company's future capital requirements, so it does not give a full picture of a company's potential performance. Given that we are looking at Shuhua Sports as potential shareholders, the cost of equity is used as the discount rate, rather than the cost of capital (or weighted average cost of capital, WACC) which accounts for debt. In this calculation we've used 9.7%, which is based on a levered beta of 1.103. Beta is a measure of a stock's volatility, compared to the market as a whole. We get our beta from the industry average beta of globally comparable companies, with an imposed limit between 0.8 and 2.0, which is a reasonable range for a stable business.
SWOT Analysis for Shuhua Sports
- Earnings growth over the past year exceeded the industry.
- Debt is not viewed as a risk.
- Dividend is in the top 25% of dividend payers in the market.
- Dividend information for 605299.
- Expensive based on P/E ratio and estimated fair value.
- Annual earnings are forecast to grow for the next 3 years.
- Dividends are not covered by earnings.
- See 605299's dividend history.
Next Steps:
Whilst important, the DCF calculation shouldn't be the only metric you look at when researching a company. The DCF model is not a perfect stock valuation tool. Preferably you'd apply different cases and assumptions and see how they would impact the company's valuation. For example, changes in the company's cost of equity or the risk free rate can significantly impact the valuation. Why is the intrinsic value lower than the current share price? For Shuhua Sports, we've put together three essential items you should explore:
- Risks: For example, we've discovered 2 warning signs for Shuhua Sports that you should be aware of before investing here.
- Future Earnings: How does 605299's growth rate compare to its peers and the wider market? Dig deeper into the analyst consensus number for the upcoming years by interacting with our free analyst growth expectation chart.
- Other Solid Businesses: Low debt, high returns on equity and good past performance are fundamental to a strong business. Why not explore our interactive list of stocks with solid business fundamentals to see if there are other companies you may not have considered!
PS. The Simply Wall St app conducts a discounted cash flow valuation for every stock on the SHSE every day. If you want to find the calculation for other stocks just search here.
Have feedback on this article? Concerned about the content? Get in touch with us directly. Alternatively, email editorial-team (at) simplywallst.com.
This article by Simply Wall St is general in nature. We provide commentary based on historical data and analyst forecasts only using an unbiased methodology and our articles are not intended to be financial advice. It does not constitute a recommendation to buy or sell any stock, and does not take account of your objectives, or your financial situation. We aim to bring you long-term focused analysis driven by fundamental data. Note that our analysis may not factor in the latest price-sensitive company announcements or qualitative material. Simply Wall St has no position in any stocks mentioned.