

Despite an already strong run, GME Group Holdings Limited (HKG:8188) shares have been powering on, with a gain of 26% in the last thirty days. Looking further back, the 19% rise over the last twelve months isn't too bad notwithstanding the strength over the last 30 days.
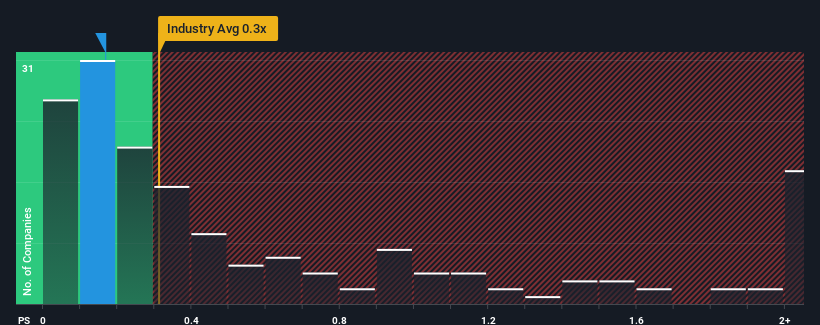
In spite of the firm bounce in price, there still wouldn't be many who think GME Group Holdings' price-to-sales (or "P/S") ratio of 0.2x is worth a mention when the median P/S in Hong Kong's Construction industry is similar at about 0.3x. However, investors might be overlooking a clear opportunity or potential setback if there is no rational basis for the P/S.
What Does GME Group Holdings' P/S Mean For Shareholders?
For instance, GME Group Holdings' receding revenue in recent times would have to be some food for thought. It might be that many expect the company to put the disappointing revenue performance behind them over the coming period, which has kept the P/S from falling. If you like the company, you'd at least be hoping this is the case so that you could potentially pick up some stock while it's not quite in favour.
We don't have analyst forecasts, but you can see how recent trends are setting up the company for the future by checking out our free report on GME Group Holdings' earnings, revenue and cash flow.How Is GME Group Holdings' Revenue Growth Trending?
There's an inherent assumption that a company should be matching the industry for P/S ratios like GME Group Holdings' to be considered reasonable.
Retrospectively, the last year delivered a frustrating 12% decrease to the company's top line. Still, the latest three year period has seen an excellent 264% overall rise in revenue, in spite of its unsatisfying short-term performance. So we can start by confirming that the company has generally done a very good job of growing revenue over that time, even though it had some hiccups along the way.
This is in contrast to the rest of the industry, which is expected to grow by 13% over the next year, materially lower than the company's recent medium-term annualised growth rates.
In light of this, it's curious that GME Group Holdings' P/S sits in line with the majority of other companies. Apparently some shareholders believe the recent performance is at its limits and have been accepting lower selling prices.
What Does GME Group Holdings' P/S Mean For Investors?
Its shares have lifted substantially and now GME Group Holdings' P/S is back within range of the industry median. It's argued the price-to-sales ratio is an inferior measure of value within certain industries, but it can be a powerful business sentiment indicator.
To our surprise, GME Group Holdings revealed its three-year revenue trends aren't contributing to its P/S as much as we would have predicted, given they look better than current industry expectations. When we see strong revenue with faster-than-industry growth, we can only assume potential risks are what might be placing pressure on the P/S ratio. It appears some are indeed anticipating revenue instability, because the persistence of these recent medium-term conditions would normally provide a boost to the share price.
Before you take the next step, you should know about the 3 warning signs for GME Group Holdings (2 shouldn't be ignored!) that we have uncovered.
It's important to make sure you look for a great company, not just the first idea you come across. So if growing profitability aligns with your idea of a great company, take a peek at this free list of interesting companies with strong recent earnings growth (and a low P/E).
Have feedback on this article? Concerned about the content? Get in touch with us directly. Alternatively, email editorial-team (at) simplywallst.com.
This article by Simply Wall St is general in nature. We provide commentary based on historical data and analyst forecasts only using an unbiased methodology and our articles are not intended to be financial advice. It does not constitute a recommendation to buy or sell any stock, and does not take account of your objectives, or your financial situation. We aim to bring you long-term focused analysis driven by fundamental data. Note that our analysis may not factor in the latest price-sensitive company announcements or qualitative material. Simply Wall St has no position in any stocks mentioned.