

Hunan Dajiaweikang Pharmaceutical Industry Co.,Ltd (SZSE:301126) shareholders are no doubt pleased to see that the share price has bounced 28% in the last month, although it is still struggling to make up recently lost ground. Unfortunately, the gains of the last month did little to right the losses of the last year with the stock still down 37% over that time.
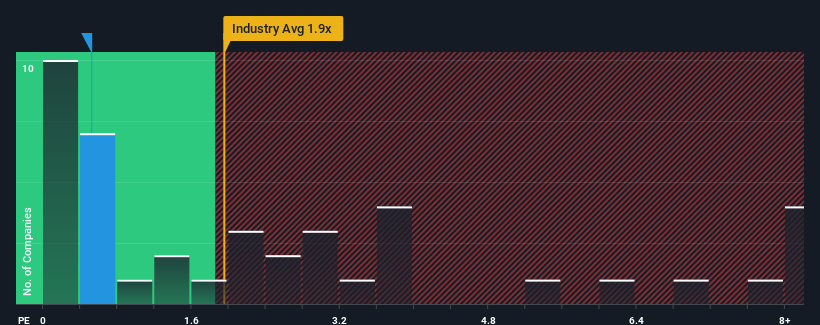
Even after such a large jump in price, Hunan Dajiaweikang Pharmaceutical IndustryLtd may still be sending buy signals at present with its price-to-sales (or "P/S") ratio of 0.5x, considering almost half of all companies in the Healthcare industry in China have P/S ratios greater than 1.9x and even P/S higher than 4x aren't out of the ordinary. Nonetheless, we'd need to dig a little deeper to determine if there is a rational basis for the reduced P/S.
How Hunan Dajiaweikang Pharmaceutical IndustryLtd Has Been Performing
Recent times have been quite advantageous for Hunan Dajiaweikang Pharmaceutical IndustryLtd as its revenue has been rising very briskly. One possibility is that the P/S ratio is low because investors think this strong revenue growth might actually underperform the broader industry in the near future. If that doesn't eventuate, then existing shareholders have reason to be quite optimistic about the future direction of the share price.
Although there are no analyst estimates available for Hunan Dajiaweikang Pharmaceutical IndustryLtd, take a look at this free data-rich visualisation to see how the company stacks up on earnings, revenue and cash flow.Is There Any Revenue Growth Forecasted For Hunan Dajiaweikang Pharmaceutical IndustryLtd?
 There's an inherent assumption that a company should underperform the industry for P/S ratios like Hunan Dajiaweikang Pharmaceutical IndustryLtd's to be considered reasonable.
Taking a look back first, we see that the company grew revenue by an impressive 30% last year. Pleasingly, revenue has also lifted 64% in aggregate from three years ago, thanks to the last 12 months of growth. Therefore, it's fair to say the revenue growth recently has been superb for the company.
Comparing that to the industry, which is predicted to deliver 18% growth in the next 12 months, the company's momentum is pretty similar based on recent medium-term annualised revenue results.
In light of this, it's peculiar that Hunan Dajiaweikang Pharmaceutical IndustryLtd's P/S sits below the majority of other companies. It may be that most investors are not convinced the company can maintain recent growth rates.
What We Can Learn From Hunan Dajiaweikang Pharmaceutical IndustryLtd's P/S?
The latest share price surge wasn't enough to lift Hunan Dajiaweikang Pharmaceutical IndustryLtd's P/S close to the industry median. Generally, our preference is to limit the use of the price-to-sales ratio to establishing what the market thinks about the overall health of a company.
The fact that Hunan Dajiaweikang Pharmaceutical IndustryLtd currently trades at a low P/S relative to the industry is unexpected considering its recent three-year growth is in line with the wider industry forecast. When we see industry-like revenue growth but a lower than expected P/S, we assume potential risks are what might be placing downward pressure on the share price. It appears some are indeed anticipating revenue instability, because the persistence of these recent medium-term conditions should normally provide more support to the share price.
Plus, you should also learn about these 5 warning signs we've spotted with Hunan Dajiaweikang Pharmaceutical IndustryLtd (including 3 which shouldn't be ignored).
If you're unsure about the strength of Hunan Dajiaweikang Pharmaceutical IndustryLtd's business, why not explore our interactive list of stocks with solid business fundamentals for some other companies you may have missed.
Have feedback on this article? Concerned about the content? Get in touch with us directly. Alternatively, email editorial-team (at) simplywallst.com.
This article by Simply Wall St is general in nature. We provide commentary based on historical data and analyst forecasts only using an unbiased methodology and our articles are not intended to be financial advice. It does not constitute a recommendation to buy or sell any stock, and does not take account of your objectives, or your financial situation. We aim to bring you long-term focused analysis driven by fundamental data. Note that our analysis may not factor in the latest price-sensitive company announcements or qualitative material. Simply Wall St has no position in any stocks mentioned.