

Shandong Sacred Sun Power Sources Co.,Ltd (SZSE:002580) shareholders are no doubt pleased to see that the share price has bounced 26% in the last month, although it is still struggling to make up recently lost ground. Unfortunately, the gains of the last month did little to right the losses of the last year with the stock still down 25% over that time.
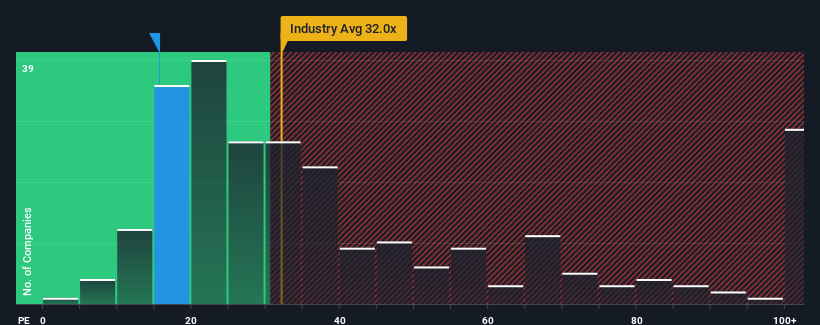
In spite of the firm bounce in price, Shandong Sacred Sun Power SourcesLtd may still be sending very bullish signals at the moment with its price-to-earnings (or "P/E") ratio of 15.6x, since almost half of all companies in China have P/E ratios greater than 32x and even P/E's higher than 59x are not unusual. Although, it's not wise to just take the P/E at face value as there may be an explanation why it's so limited.
Shandong Sacred Sun Power SourcesLtd certainly has been doing a great job lately as it's been growing earnings at a really rapid pace. One possibility is that the P/E is low because investors think this strong earnings growth might actually underperform the broader market in the near future. If that doesn't eventuate, then existing shareholders have reason to be quite optimistic about the future direction of the share price.
Does Growth Match The Low P/E?
The only time you'd be truly comfortable seeing a P/E as depressed as Shandong Sacred Sun Power SourcesLtd's is when the company's growth is on track to lag the market decidedly.
Taking a look back first, we see that the company grew earnings per share by an impressive 130% last year. The latest three year period has also seen an excellent 479% overall rise in EPS, aided by its short-term performance. So we can start by confirming that the company has done a great job of growing earnings over that time.
This is in contrast to the rest of the market, which is expected to grow by 40% over the next year, materially lower than the company's recent medium-term annualised growth rates.
With this information, we find it odd that Shandong Sacred Sun Power SourcesLtd is trading at a P/E lower than the market. It looks like most investors are not convinced the company can maintain its recent growth rates.
What We Can Learn From Shandong Sacred Sun Power SourcesLtd's P/E?
Even after such a strong price move, Shandong Sacred Sun Power SourcesLtd's P/E still trails the rest of the market significantly. We'd say the price-to-earnings ratio's power isn't primarily as a valuation instrument but rather to gauge current investor sentiment and future expectations.
Our examination of Shandong Sacred Sun Power SourcesLtd revealed its three-year earnings trends aren't contributing to its P/E anywhere near as much as we would have predicted, given they look better than current market expectations. There could be some major unobserved threats to earnings preventing the P/E ratio from matching this positive performance. It appears many are indeed anticipating earnings instability, because the persistence of these recent medium-term conditions would normally provide a boost to the share price.
It is also worth noting that we have found 1 warning sign for Shandong Sacred Sun Power SourcesLtd that you need to take into consideration.
Of course, you might also be able to find a better stock than Shandong Sacred Sun Power SourcesLtd. So you may wish to see this free collection of other companies that have reasonable P/E ratios and have grown earnings strongly.
Have feedback on this article? Concerned about the content? Get in touch with us directly. Alternatively, email editorial-team (at) simplywallst.com.
This article by Simply Wall St is general in nature. We provide commentary based on historical data and analyst forecasts only using an unbiased methodology and our articles are not intended to be financial advice. It does not constitute a recommendation to buy or sell any stock, and does not take account of your objectives, or your financial situation. We aim to bring you long-term focused analysis driven by fundamental data. Note that our analysis may not factor in the latest price-sensitive company announcements or qualitative material. Simply Wall St has no position in any stocks mentioned.