

Even though Zhongxing Shenyang Commercial Building Group Co.,Ltd's (SZSE:000715) recent earnings release was robust, the market didn't seem to notice. Investors are probably missing some underlying factors which are encouraging for the future of the company.
Zooming In On Zhongxing Shenyang Commercial Building GroupLtd's Earnings
Many investors haven't heard of the accrual ratio from cashflow, but it is actually a useful measure of how well a company's profit is backed up by free cash flow (FCF) during a given period. To get the accrual ratio we first subtract FCF from profit for a period, and then divide that number by the average operating assets for the period. The ratio shows us how much a company's profit exceeds its FCF.
That means a negative accrual ratio is a good thing, because it shows that the company is bringing in more free cash flow than its profit would suggest. While it's not a problem to have a positive accrual ratio, indicating a certain level of non-cash profits, a high accrual ratio is arguably a bad thing, because it indicates paper profits are not matched by cash flow. That's because some academic studies have suggested that high accruals ratios tend to lead to lower profit or less profit growth.
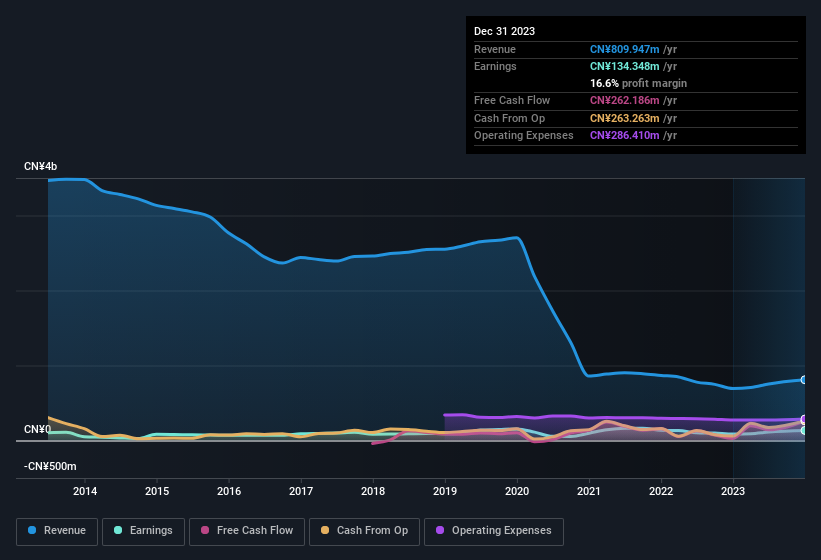
Zhongxing Shenyang Commercial Building GroupLtd has an accrual ratio of -0.19 for the year to December 2023. That implies it has very good cash conversion, and that its earnings in the last year actually significantly understate its free cash flow. In fact, it had free cash flow of CN¥262m in the last year, which was a lot more than its statutory profit of CN¥134.3m. Zhongxing Shenyang Commercial Building GroupLtd's free cash flow improved over the last year, which is generally good to see.
That might leave you wondering what analysts are forecasting in terms of future profitability. Luckily, you can click here to see an interactive graph depicting future profitability, based on their estimates.
Our Take On Zhongxing Shenyang Commercial Building GroupLtd's Profit Performance
Happily for shareholders, Zhongxing Shenyang Commercial Building GroupLtd produced plenty of free cash flow to back up its statutory profit numbers. Based on this observation, we consider it possible that Zhongxing Shenyang Commercial Building GroupLtd's statutory profit actually understates its earnings potential! And the EPS is up 39% annually, over the last three years. Of course, we've only just scratched the surface when it comes to analysing its earnings; one could also consider margins, forecast growth, and return on investment, among other factors. So if you'd like to dive deeper into this stock, it's crucial to consider any risks it's facing. In terms of investment risks, we've identified 1 warning sign with Zhongxing Shenyang Commercial Building GroupLtd, and understanding it should be part of your investment process.
Today we've zoomed in on a single data point to better understand the nature of Zhongxing Shenyang Commercial Building GroupLtd's profit. But there are plenty of other ways to inform your opinion of a company. For example, many people consider a high return on equity as an indication of favorable business economics, while others like to 'follow the money' and search out stocks that insiders are buying. While it might take a little research on your behalf, you may find this free collection of companies boasting high return on equity, or this list of stocks that insiders are buying to be useful.
Have feedback on this article? Concerned about the content? Get in touch with us directly. Alternatively, email editorial-team (at) simplywallst.com.
This article by Simply Wall St is general in nature. We provide commentary based on historical data and analyst forecasts only using an unbiased methodology and our articles are not intended to be financial advice. It does not constitute a recommendation to buy or sell any stock, and does not take account of your objectives, or your financial situation. We aim to bring you long-term focused analysis driven by fundamental data. Note that our analysis may not factor in the latest price-sensitive company announcements or qualitative material. Simply Wall St has no position in any stocks mentioned.