

Tianjin Tianbao Energy Co., Ltd. (HKG:1671) shareholders would be excited to see that the share price has had a great month, posting a 26% gain and recovering from prior weakness. Notwithstanding the latest gain, the annual share price return of 5.9% isn't as impressive.
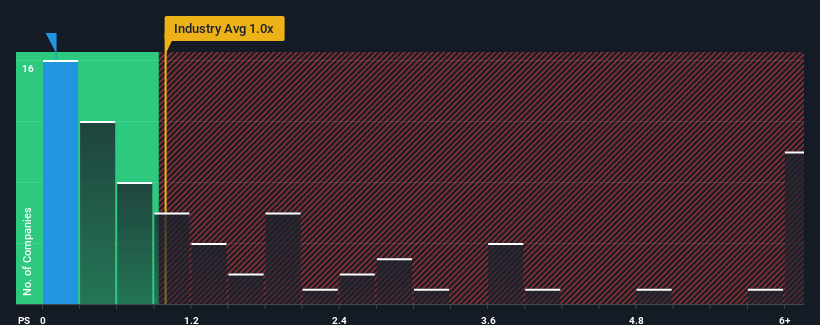
Although its price has surged higher, Tianjin Tianbao Energy may still be sending very bullish signals at the moment with its price-to-sales (or "P/S") ratio of 0.1x, since almost half of all companies in the Electric Utilities industry in Hong Kong have P/S ratios greater than 2.8x and even P/S higher than 15x are not unusual. Nonetheless, we'd need to dig a little deeper to determine if there is a rational basis for the highly reduced P/S.
What Does Tianjin Tianbao Energy's Recent Performance Look Like?
Revenue has risen firmly for Tianjin Tianbao Energy recently, which is pleasing to see. It might be that many expect the respectable revenue performance to degrade substantially, which has repressed the P/S. Those who are bullish on Tianjin Tianbao Energy will be hoping that this isn't the case, so that they can pick up the stock at a lower valuation.
Want the full picture on earnings, revenue and cash flow for the company? Then our free report on Tianjin Tianbao Energy will help you shine a light on its historical performance.Do Revenue Forecasts Match The Low P/S Ratio?
 There's an inherent assumption that a company should far underperform the industry for P/S ratios like Tianjin Tianbao Energy's to be considered reasonable.
Retrospectively, the last year delivered a decent 10% gain to the company's revenues. Pleasingly, revenue has also lifted 63% in aggregate from three years ago, partly thanks to the last 12 months of growth. Accordingly, shareholders would have definitely welcomed those medium-term rates of revenue growth.
This is in contrast to the rest of the industry, which is expected to grow by 4.5% over the next year, materially lower than the company's recent medium-term annualised growth rates.
With this information, we find it odd that Tianjin Tianbao Energy is trading at a P/S lower than the industry. Apparently some shareholders believe the recent performance has exceeded its limits and have been accepting significantly lower selling prices.
The Key Takeaway
Even after such a strong price move, Tianjin Tianbao Energy's P/S still trails the rest of the industry. Typically, we'd caution against reading too much into price-to-sales ratios when settling on investment decisions, though it can reveal plenty about what other market participants think about the company.
Our examination of Tianjin Tianbao Energy revealed its three-year revenue trends aren't boosting its P/S anywhere near as much as we would have predicted, given they look better than current industry expectations. Potential investors that are sceptical over continued revenue performance may be preventing the P/S ratio from matching previous strong performance. At least price risks look to be very low if recent medium-term revenue trends continue, but investors seem to think future revenue could see a lot of volatility.
Plus, you should also learn about these 4 warning signs we've spotted with Tianjin Tianbao Energy (including 2 which are a bit unpleasant).
If companies with solid past earnings growth is up your alley, you may wish to see this free collection of other companies with strong earnings growth and low P/E ratios.
Have feedback on this article? Concerned about the content? Get in touch with us directly. Alternatively, email editorial-team (at) simplywallst.com.
This article by Simply Wall St is general in nature. We provide commentary based on historical data and analyst forecasts only using an unbiased methodology and our articles are not intended to be financial advice. It does not constitute a recommendation to buy or sell any stock, and does not take account of your objectives, or your financial situation. We aim to bring you long-term focused analysis driven by fundamental data. Note that our analysis may not factor in the latest price-sensitive company announcements or qualitative material. Simply Wall St has no position in any stocks mentioned.