

Nanjing Sinolife United Company Limited (HKG:3332) shareholders would be excited to see that the share price has had a great month, posting a 27% gain and recovering from prior weakness. The last month tops off a massive increase of 223% in the last year.
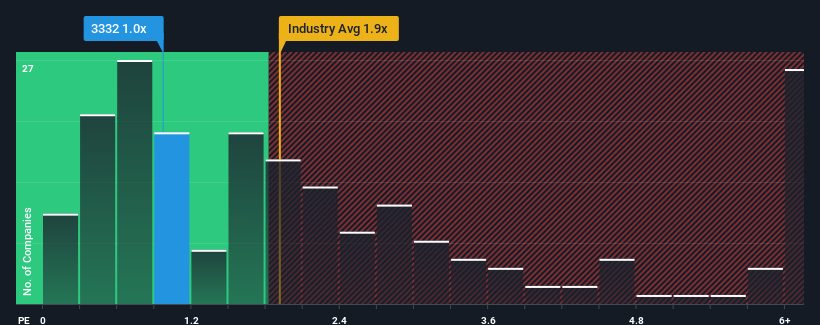
In spite of the firm bounce in price, it's still not a stretch to say that Nanjing Sinolife United's price-to-sales (or "P/S") ratio of 1x right now seems quite "middle-of-the-road" compared to the Personal Products industry in Hong Kong, where the median P/S ratio is around 0.9x. Although, it's not wise to simply ignore the P/S without explanation as investors may be disregarding a distinct opportunity or a costly mistake.
What Does Nanjing Sinolife United's Recent Performance Look Like?
With revenue growth that's exceedingly strong of late, Nanjing Sinolife United has been doing very well. It might be that many expect the strong revenue performance to wane, which has kept the share price, and thus the P/S ratio, from rising. Those who are bullish on Nanjing Sinolife United will be hoping that this isn't the case, so that they can pick up the stock at a lower valuation.
Want the full picture on earnings, revenue and cash flow for the company? Then our free report on Nanjing Sinolife United will help you shine a light on its historical performance.What Are Revenue Growth Metrics Telling Us About The P/S?
The only time you'd be comfortable seeing a P/S like Nanjing Sinolife United's is when the company's growth is tracking the industry closely.
Retrospectively, the last year delivered an exceptional 105% gain to the company's top line. The strong recent performance means it was also able to grow revenue by 90% in total over the last three years. Accordingly, shareholders would have definitely welcomed those medium-term rates of revenue growth.
Comparing that recent medium-term revenue trajectory with the industry's one-year growth forecast of 11% shows it's noticeably more attractive.
In light of this, it's curious that Nanjing Sinolife United's P/S sits in line with the majority of other companies. It may be that most investors are not convinced the company can maintain its recent growth rates.
The Key Takeaway
Its shares have lifted substantially and now Nanjing Sinolife United's P/S is back within range of the industry median. We'd say the price-to-sales ratio's power isn't primarily as a valuation instrument but rather to gauge current investor sentiment and future expectations.
To our surprise, Nanjing Sinolife United revealed its three-year revenue trends aren't contributing to its P/S as much as we would have predicted, given they look better than current industry expectations. It'd be fair to assume that potential risks the company faces could be the contributing factor to the lower than expected P/S. At least the risk of a price drop looks to be subdued if recent medium-term revenue trends continue, but investors seem to think future revenue could see some volatility.
Before you settle on your opinion, we've discovered 2 warning signs for Nanjing Sinolife United that you should be aware of.
Of course, profitable companies with a history of great earnings growth are generally safer bets. So you may wish to see this free collection of other companies that have reasonable P/E ratios and have grown earnings strongly.
Have feedback on this article? Concerned about the content? Get in touch with us directly. Alternatively, email editorial-team (at) simplywallst.com.
This article by Simply Wall St is general in nature. We provide commentary based on historical data and analyst forecasts only using an unbiased methodology and our articles are not intended to be financial advice. It does not constitute a recommendation to buy or sell any stock, and does not take account of your objectives, or your financial situation. We aim to bring you long-term focused analysis driven by fundamental data. Note that our analysis may not factor in the latest price-sensitive company announcements or qualitative material. Simply Wall St has no position in any stocks mentioned.
Have feedback on this article? Concerned about the content? Get in touch with us directly. Alternatively, email editorial-team@simplywallst.com