

David Iben put it well when he said, 'Volatility is not a risk we care about. What we care about is avoiding the permanent loss of capital.' So it seems the smart money knows that debt - which is usually involved in bankruptcies - is a very important factor, when you assess how risky a company is. Importantly, National Silicon Industry Group Co.,Ltd. (SHSE:688126) does carry debt. But should shareholders be worried about its use of debt?
When Is Debt Dangerous?
Debt and other liabilities become risky for a business when it cannot easily fulfill those obligations, either with free cash flow or by raising capital at an attractive price. Part and parcel of capitalism is the process of 'creative destruction' where failed businesses are mercilessly liquidated by their bankers. However, a more frequent (but still costly) occurrence is where a company must issue shares at bargain-basement prices, permanently diluting shareholders, just to shore up its balance sheet. By replacing dilution, though, debt can be an extremely good tool for businesses that need capital to invest in growth at high rates of return. The first thing to do when considering how much debt a business uses is to look at its cash and debt together.
How Much Debt Does National Silicon Industry GroupLtd Carry?
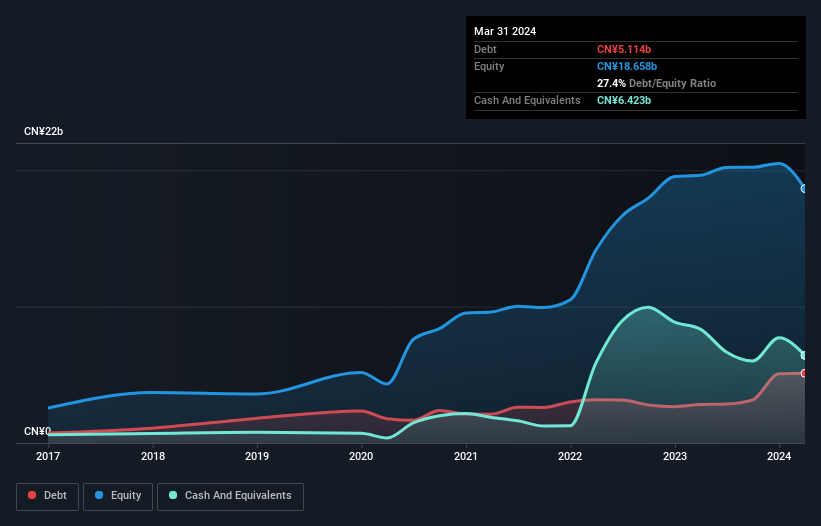
The image below, which you can click on for greater detail, shows that at March 2024 National Silicon Industry GroupLtd had debt of CN¥5.11b, up from CN¥2.83b in one year. However, its balance sheet shows it holds CN¥6.42b in cash, so it actually has CN¥1.31b net cash.
How Strong Is National Silicon Industry GroupLtd's Balance Sheet?
Zooming in on the latest balance sheet data, we can see that National Silicon Industry GroupLtd had liabilities of CN¥2.79b due within 12 months and liabilities of CN¥5.53b due beyond that. On the other hand, it had cash of CN¥6.42b and CN¥957.0m worth of receivables due within a year. So it has liabilities totalling CN¥945.2m more than its cash and near-term receivables, combined.
Of course, National Silicon Industry GroupLtd has a market capitalization of CN¥37.9b, so these liabilities are probably manageable. However, we do think it is worth keeping an eye on its balance sheet strength, as it may change over time. Despite its noteworthy liabilities, National Silicon Industry GroupLtd boasts net cash, so it's fair to say it does not have a heavy debt load! When analysing debt levels, the balance sheet is the obvious place to start. But ultimately the future profitability of the business will decide if National Silicon Industry GroupLtd can strengthen its balance sheet over time. So if you want to see what the professionals think, you might find this free report on analyst profit forecasts to be interesting.
In the last year National Silicon Industry GroupLtd had a loss before interest and tax, and actually shrunk its revenue by 14%, to CN¥3.1b. We would much prefer see growth.
So How Risky Is National Silicon Industry GroupLtd?
By their very nature companies that are losing money are more risky than those with a long history of profitability. And we do note that National Silicon Industry GroupLtd had an earnings before interest and tax (EBIT) loss, over the last year. Indeed, in that time it burnt through CN¥4.7b of cash and made a loss of CN¥116m. With only CN¥1.31b on the balance sheet, it would appear that its going to need to raise capital again soon. Summing up, we're a little skeptical of this one, as it seems fairly risky in the absence of free cashflow. When we look at a riskier company, we like to check how their profits (or losses) are trending over time. Today, we're providing readers this interactive graph showing how National Silicon Industry GroupLtd's profit, revenue, and operating cashflow have changed over the last few years.
Of course, if you're the type of investor who prefers buying stocks without the burden of debt, then don't hesitate to discover our exclusive list of net cash growth stocks, today.
Have feedback on this article? Concerned about the content? Get in touch with us directly. Alternatively, email editorial-team (at) simplywallst.com.
This article by Simply Wall St is general in nature. We provide commentary based on historical data and analyst forecasts only using an unbiased methodology and our articles are not intended to be financial advice. It does not constitute a recommendation to buy or sell any stock, and does not take account of your objectives, or your financial situation. We aim to bring you long-term focused analysis driven by fundamental data. Note that our analysis may not factor in the latest price-sensitive company announcements or qualitative material. Simply Wall St has no position in any stocks mentioned.
Have feedback on this article? Concerned about the content? Get in touch with us directly. Alternatively, email editorial-team@simplywallst.com