

To the annoyance of some shareholders, Energy International Investments Holdings Limited (HKG:353) shares are down a considerable 37% in the last month, which continues a horrid run for the company. The drop over the last 30 days has capped off a tough year for shareholders, with the share price down 15% in that time.
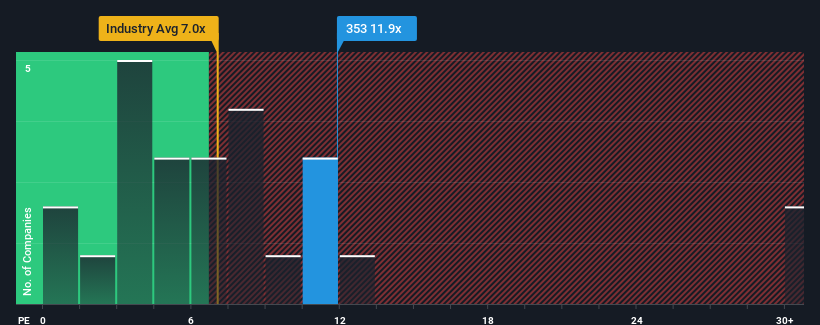
In spite of the heavy fall in price, Energy International Investments Holdings may still be sending bearish signals at the moment with its price-to-earnings (or "P/E") ratio of 11.9x, since almost half of all companies in Hong Kong have P/E ratios under 9x and even P/E's lower than 5x are not unusual. However, the P/E might be high for a reason and it requires further investigation to determine if it's justified.
As an illustration, earnings have deteriorated at Energy International Investments Holdings over the last year, which is not ideal at all. One possibility is that the P/E is high because investors think the company will still do enough to outperform the broader market in the near future. You'd really hope so, otherwise you're paying a pretty hefty price for no particular reason.
What Are Growth Metrics Telling Us About The High P/E?
Energy International Investments Holdings' P/E ratio would be typical for a company that's expected to deliver solid growth, and importantly, perform better than the market.
If we review the last year of earnings, dishearteningly the company's profits fell to the tune of 55%. Still, the latest three year period has seen an excellent 542% overall rise in EPS, in spite of its unsatisfying short-term performance. Although it's been a bumpy ride, it's still fair to say the earnings growth recently has been more than adequate for the company.
Comparing that to the market, which is only predicted to deliver 20% growth in the next 12 months, the company's momentum is stronger based on recent medium-term annualised earnings results.
In light of this, it's understandable that Energy International Investments Holdings' P/E sits above the majority of other companies. It seems most investors are expecting this strong growth to continue and are willing to pay more for the stock.
The Final Word
There's still some solid strength behind Energy International Investments Holdings' P/E, if not its share price lately. While the price-to-earnings ratio shouldn't be the defining factor in whether you buy a stock or not, it's quite a capable barometer of earnings expectations.
As we suspected, our examination of Energy International Investments Holdings revealed its three-year earnings trends are contributing to its high P/E, given they look better than current market expectations. Right now shareholders are comfortable with the P/E as they are quite confident earnings aren't under threat. If recent medium-term earnings trends continue, it's hard to see the share price falling strongly in the near future under these circumstances.
Having said that, be aware Energy International Investments Holdings is showing 3 warning signs in our investment analysis, you should know about.
You might be able to find a better investment than Energy International Investments Holdings. If you want a selection of possible candidates, check out this free list of interesting companies that trade on a low P/E (but have proven they can grow earnings).
Have feedback on this article? Concerned about the content? Get in touch with us directly. Alternatively, email editorial-team (at) simplywallst.com.
This article by Simply Wall St is general in nature. We provide commentary based on historical data and analyst forecasts only using an unbiased methodology and our articles are not intended to be financial advice. It does not constitute a recommendation to buy or sell any stock, and does not take account of your objectives, or your financial situation. We aim to bring you long-term focused analysis driven by fundamental data. Note that our analysis may not factor in the latest price-sensitive company announcements or qualitative material. Simply Wall St has no position in any stocks mentioned.
Have feedback on this article? Concerned about the content? Get in touch with us directly. Alternatively, email editorial-team@simplywallst.com