Significant control over Innodata by individual investors implies that the general public has more power to influence management and governance-related decisions
42% of the business is held by the top 25 shareholders
Institutional ownership in Innodata is 38%
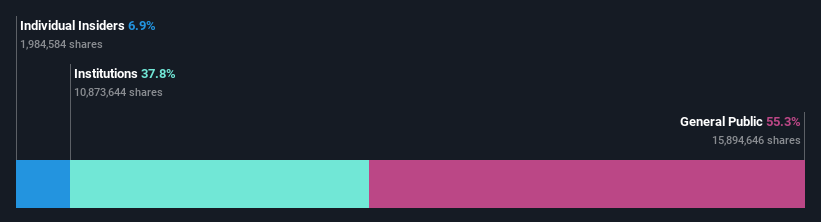
A look at the shareholders of Innodata Inc. (NASDAQ:INOD) can tell us which group is most powerful. We can see that individual investors own the lion's share in the company with 55% ownership. Put another way, the group faces the maximum upside potential (or downside risk).
While individual investors were the group that reaped the most benefits after last week's 13% price gain, institutions also received a 38% cut.
Let's delve deeper into each type of owner of Innodata, beginning with the chart below.
NasdaqGM:INOD Ownership Breakdown July 13th 2024
What Does The Institutional Ownership Tell Us About Innodata?
Institutional investors commonly compare their own returns to the returns of a commonly followed index. So they generally do consider buying larger companies that are included in the relevant benchmark index.
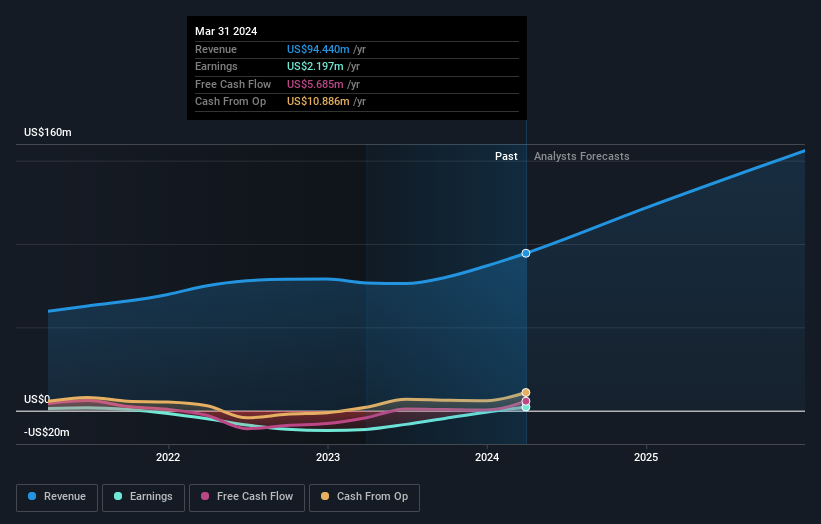
Innodata already has institutions on the share registry. Indeed, they own a respectable stake in the company. This implies the analysts working for those institutions have looked at the stock and they like it. But just like anyone else, they could be wrong. It is not uncommon to see a big share price drop if two large institutional investors try to sell out of a stock at the same time. So it is worth checking the past earnings trajectory of Innodata, (below). Of course, keep in mind that there are other factors to consider, too.
NasdaqGM:INOD Earnings and Revenue Growth July 13th 2024
We note that hedge funds don't have a meaningful investment in Innodata. The company's largest shareholder is BlackRock, Inc., with ownership of 6.3%. With 5.5% and 5.1% of the shares outstanding respectively, Luzich Partners and The Vanguard Group, Inc. are the second and third largest shareholders. In addition, we found that Jack Abuhoff, the CEO has 4.1% of the shares allocated to their name.
Our studies suggest that the top 25 shareholders collectively control less than half of the company's shares, meaning that the company's shares are widely disseminated and there is no dominant shareholder.
While it makes sense to study institutional ownership data for a company, it also makes sense to study analyst sentiments to know which way the wind is blowing. There is some analyst coverage of the stock, but it could still become more well known, with time.
Insider Ownership Of Innodata
The definition of an insider can differ slightly between different countries, but members of the board of directors always count. Company management run the business, but the CEO will answer to the board, even if he or she is a member of it.
I generally consider insider ownership to be a good thing. However, on some occasions it makes it more difficult for other shareholders to hold the board accountable for decisions.
Shareholders would probably be interested to learn that insiders own shares in Innodata Inc.. As individuals, the insiders collectively own US$34m worth of the US$486m company. Some would say this shows alignment of interests between shareholders and the board. But it might be worth checking if those insiders have been selling.
General Public Ownership
The general public, mostly comprising of individual investors, collectively holds 55% of Innodata shares. With this amount of ownership, retail investors can collectively play a role in decisions that affect shareholder returns, such as dividend policies and the appointment of directors. They can also exercise the power to vote on acquisitions or mergers that may not improve profitability.
Next Steps:
It's always worth thinking about the different groups who own shares in a company. But to understand Innodata better, we need to consider many other factors. Be aware that Innodata is showing 2 warning signs in our investment analysis , and 1 of those is a bit concerning...
But ultimately it is the future, not the past, that will determine how well the owners of this business will do. Therefore we think it advisable to take a look at this free report showing whether analysts are predicting a brighter future.
NB: Figures in this article are calculated using data from the last twelve months, which refer to the 12-month period ending on the last date of the month the financial statement is dated. This may not be consistent with full year annual report figures.
Have feedback on this article? Concerned about the content?Get in touch with us directly. Alternatively, email editorial-team (at) simplywallst.com. This article by Simply Wall St is general in nature. We provide commentary based on historical data and analyst forecasts only using an unbiased methodology and our articles are not intended to be financial advice. It does not constitute a recommendation to buy or sell any stock, and does not take account of your objectives, or your financial situation. We aim to bring you long-term focused analysis driven by fundamental data. Note that our analysis may not factor in the latest price-sensitive company announcements or qualitative material. Simply Wall St has no position in any stocks mentioned.
Have feedback on this article? Concerned about the content? Get in touch with us directly. Alternatively, email editorial-team@simplywallst.com
オーストラリアでは、moomooの投資商品及びサービスはMoomoo Securities Australia Limitedによって提供され、オーストラリア証券投資委員会(ASIC)の管理を受けております(AFSL No. 224663)。「金融サービスガイド」、「利用規約」、「プライバシーポリシー」などの詳細は、Moomoo Securities Australia Limitedのウェブサイトhttps://www.moomoo.com/auでご確認いただけます。
オーストラリアでは、moomooの投資商品及びサービスはMoomoo Securities Australia Limitedによって提供され、オーストラリア証券投資委員会(ASIC)の管理を受けております(AFSL No. 224663)。「金融サービスガイド」、「利用規約」、「プライバシーポリシー」などの詳細は、Moomoo Securities Australia Limitedのウェブサイトhttps://www.moomoo.com/auでご確認いただけます。