

Key Insights
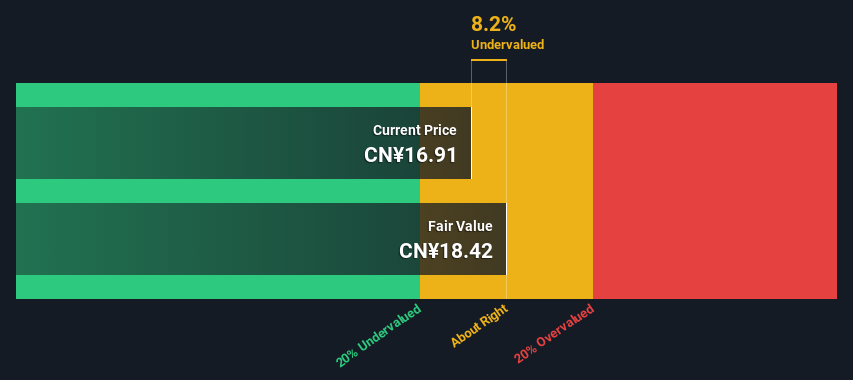
- The projected fair value for Zhejiang Yinlun MachineryLtd is CN¥18.42 based on 2 Stage Free Cash Flow to Equity
- Current share price of CN¥16.91 suggests Zhejiang Yinlun MachineryLtd is potentially trading close to its fair value
- Our fair value estimate is 18% lower than Zhejiang Yinlun MachineryLtd's analyst price target of CN¥22.56
Today we will run through one way of estimating the intrinsic value of Zhejiang Yinlun Machinery Co.,Ltd. (SZSE:002126) by taking the forecast future cash flows of the company and discounting them back to today's value. One way to achieve this is by employing the Discounted Cash Flow (DCF) model. It may sound complicated, but actually it is quite simple!
Companies can be valued in a lot of ways, so we would point out that a DCF is not perfect for every situation. Anyone interested in learning a bit more about intrinsic value should have a read of the Simply Wall St analysis model.
The Calculation
We use what is known as a 2-stage model, which simply means we have two different periods of growth rates for the company's cash flows. Generally the first stage is higher growth, and the second stage is a lower growth phase. To begin with, we have to get estimates of the next ten years of cash flows. Where possible we use analyst estimates, but when these aren't available we extrapolate the previous free cash flow (FCF) from the last estimate or reported value. We assume companies with shrinking free cash flow will slow their rate of shrinkage, and that companies with growing free cash flow will see their growth rate slow, over this period. We do this to reflect that growth tends to slow more in the early years than it does in later years.
 Generally we assume that a dollar today is more valuable than a dollar in the future, so we discount the value of these future cash flows to their estimated value in today's dollars:
10-year free cash flow (FCF) forecast
| 2025 | 2026 | 2027 | 2028 | 2029 | 2030 | 2031 | 2032 | 2033 | 2034 | |
| Levered FCF (CN¥, Millions) | CN¥690.0m | CN¥857.0m | CN¥983.7m | CN¥1.09b | CN¥1.19b | CN¥1.27b | CN¥1.35b | CN¥1.41b | CN¥1.47b | CN¥1.53b |
| Growth Rate Estimate Source | Analyst x1 | Analyst x1 | Est @ 14.78% | Est @ 11.22% | Est @ 8.72% | Est @ 6.98% | Est @ 5.75% | Est @ 4.90% | Est @ 4.30% | Est @ 3.88% |
| Present Value (CN¥, Millions) Discounted @ 10% | CN¥627 | CN¥707 | CN¥737 | CN¥745 | CN¥736 | CN¥715 | CN¥687 | CN¥654 | CN¥620 | CN¥585 |
("Est" = FCF growth rate estimated by Simply Wall St)
Present Value of 10-year Cash Flow (PVCF) = CN¥6.8b
We now need to calculate the Terminal Value, which accounts for all the future cash flows after this ten year period. For a number of reasons a very conservative growth rate is used that cannot exceed that of a country's GDP growth. In this case we have used the 5-year average of the 10-year government bond yield (2.9%) to estimate future growth. In the same way as with the 10-year 'growth' period, we discount future cash flows to today's value, using a cost of equity of 10%.
Terminal Value (TV)= FCF2034 × (1 + g) ÷ (r – g) = CN¥1.5b× (1 + 2.9%) ÷ (10%– 2.9%) = CN¥22b
Present Value of Terminal Value (PVTV)= TV / (1 + r)10= CN¥22b÷ ( 1 + 10%)10= CN¥8.4b
The total value, or equity value, is then the sum of the present value of the future cash flows, which in this case is CN¥15b. In the final step we divide the equity value by the number of shares outstanding. Relative to the current share price of CN¥16.9, the company appears about fair value at a 8.2% discount to where the stock price trades currently. The assumptions in any calculation have a big impact on the valuation, so it is better to view this as a rough estimate, not precise down to the last cent.
The Assumptions
Now the most important inputs to a discounted cash flow are the discount rate, and of course, the actual cash flows. Part of investing is coming up with your own evaluation of a company's future performance, so try the calculation yourself and check your own assumptions. The DCF also does not consider the possible cyclicality of an industry, or a company's future capital requirements, so it does not give a full picture of a company's potential performance. Given that we are looking at Zhejiang Yinlun MachineryLtd as potential shareholders, the cost of equity is used as the discount rate, rather than the cost of capital (or weighted average cost of capital, WACC) which accounts for debt. In this calculation we've used 10%, which is based on a levered beta of 1.277. Beta is a measure of a stock's volatility, compared to the market as a whole. We get our beta from the industry average beta of globally comparable companies, with an imposed limit between 0.8 and 2.0, which is a reasonable range for a stable business.
SWOT Analysis for Zhejiang Yinlun MachineryLtd
- Earnings growth over the past year exceeded the industry.
- Debt is well covered by earnings.
- Balance sheet summary for 002126.
- Dividend is low compared to the top 25% of dividend payers in the Auto Components market.
- Shareholders have been diluted in the past year.
- Annual earnings are forecast to grow faster than the Chinese market.
- Good value based on P/E ratio and estimated fair value.
- Debt is not well covered by operating cash flow.
- Paying a dividend but company has no free cash flows.
- Revenue is forecast to grow slower than 20% per year.
- Is 002126 well equipped to handle threats?
Next Steps:
Valuation is only one side of the coin in terms of building your investment thesis, and it ideally won't be the sole piece of analysis you scrutinize for a company. The DCF model is not a perfect stock valuation tool. Instead the best use for a DCF model is to test certain assumptions and theories to see if they would lead to the company being undervalued or overvalued. For example, changes in the company's cost of equity or the risk free rate can significantly impact the valuation. For Zhejiang Yinlun MachineryLtd, we've put together three pertinent aspects you should look at:
- Risks: For example, we've discovered 2 warning signs for Zhejiang Yinlun MachineryLtd (1 shouldn't be ignored!) that you should be aware of before investing here.
- Future Earnings: How does 002126's growth rate compare to its peers and the wider market? Dig deeper into the analyst consensus number for the upcoming years by interacting with our free analyst growth expectation chart.
- Other High Quality Alternatives: Do you like a good all-rounder? Explore our interactive list of high quality stocks to get an idea of what else is out there you may be missing!
PS. The Simply Wall St app conducts a discounted cash flow valuation for every stock on the SZSE every day. If you want to find the calculation for other stocks just search here.
Have feedback on this article? Concerned about the content? Get in touch with us directly. Alternatively, email editorial-team (at) simplywallst.com.
This article by Simply Wall St is general in nature. We provide commentary based on historical data and analyst forecasts only using an unbiased methodology and our articles are not intended to be financial advice. It does not constitute a recommendation to buy or sell any stock, and does not take account of your objectives, or your financial situation. We aim to bring you long-term focused analysis driven by fundamental data. Note that our analysis may not factor in the latest price-sensitive company announcements or qualitative material. Simply Wall St has no position in any stocks mentioned.
Have feedback on this article? Concerned about the content? Get in touch with us directly. Alternatively, email editorial-team@simplywallst.com