Dutch Bros' significant individual investors ownership suggests that the key decisions are influenced by shareholders from the larger public
A total of 25 investors have a majority stake in the company with 28% ownership
Insiders have been selling lately
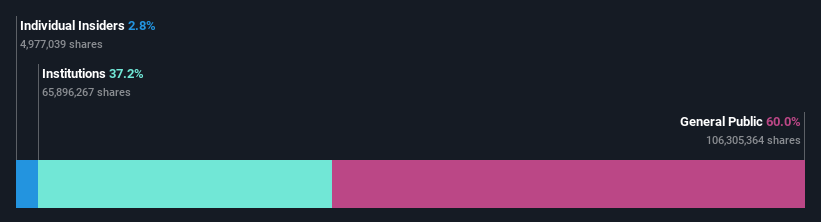
Every investor in Dutch Bros Inc. (NYSE:BROS) should be aware of the most powerful shareholder groups. We can see that individual investors own the lion's share in the company with 60% ownership. In other words, the group stands to gain the most (or lose the most) from their investment into the company.
While institutions who own 37% came under pressure after market cap dropped to US$6.8b last week,individual investors took the most losses.
Let's take a closer look to see what the different types of shareholders can tell us about Dutch Bros.
NYSE:BROS Ownership Breakdown July 20th 2024
What Does The Institutional Ownership Tell Us About Dutch Bros?
Many institutions measure their performance against an index that approximates the local market. So they usually pay more attention to companies that are included in major indices.
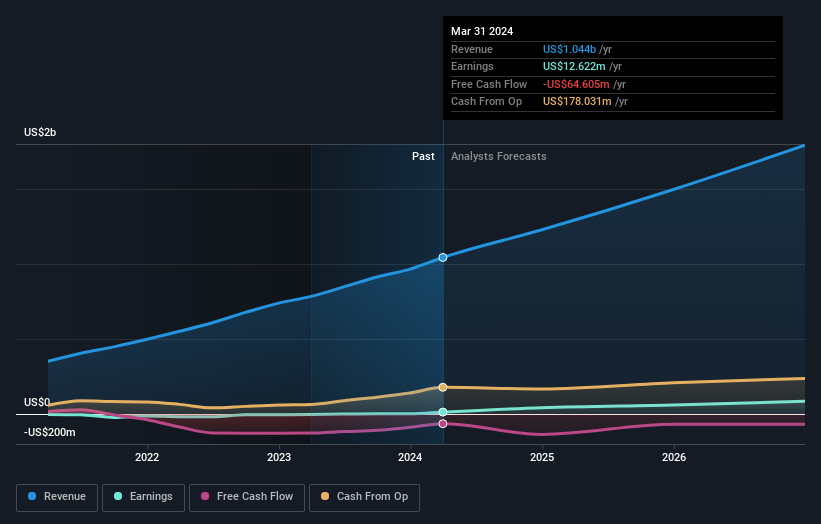
Dutch Bros already has institutions on the share registry. Indeed, they own a respectable stake in the company. This implies the analysts working for those institutions have looked at the stock and they like it. But just like anyone else, they could be wrong. When multiple institutions own a stock, there's always a risk that they are in a 'crowded trade'. When such a trade goes wrong, multiple parties may compete to sell stock fast. This risk is higher in a company without a history of growth. You can see Dutch Bros' historic earnings and revenue below, but keep in mind there's always more to the story.
NYSE:BROS Earnings and Revenue Growth July 20th 2024
We note that hedge funds don't have a meaningful investment in Dutch Bros. Looking at our data, we can see that the largest shareholder is The Vanguard Group, Inc. with 3.6% of shares outstanding. Citadel Advisors LLC is the second largest shareholder owning 2.7% of common stock, and FMR LLC holds about 2.4% of the company stock.
Our studies suggest that the top 25 shareholders collectively control less than half of the company's shares, meaning that the company's shares are widely disseminated and there is no dominant shareholder.
Researching institutional ownership is a good way to gauge and filter a stock's expected performance. The same can be achieved by studying analyst sentiments. Quite a few analysts cover the stock, so you could look into forecast growth quite easily.
Insider Ownership Of Dutch Bros
The definition of an insider can differ slightly between different countries, but members of the board of directors always count. The company management answer to the board and the latter should represent the interests of shareholders. Notably, sometimes top-level managers are on the board themselves.
Most consider insider ownership a positive because it can indicate the board is well aligned with other shareholders. However, on some occasions too much power is concentrated within this group.
Our most recent data indicates that insiders own some shares in Dutch Bros Inc.. It is a pretty big company, so it is generally a positive to see some potentially meaningful alignment. In this case, they own around US$192m worth of shares (at current prices). Most would say this shows alignment of interests between shareholders and the board. Still, it might be worth checking if those insiders have been selling.
General Public Ownership
The general public -- including retail investors -- own 60% of Dutch Bros. This size of ownership gives investors from the general public some collective power. They can and probably do influence decisions on executive compensation, dividend policies and proposed business acquisitions.
Next Steps:
I find it very interesting to look at who exactly owns a company. But to truly gain insight, we need to consider other information, too. For example, we've discovered 2 warning signs for Dutch Bros that you should be aware of before investing here.
If you are like me, you may want to think about whether this company will grow or shrink. Luckily, you can check this free report showing analyst forecasts for its future.
NB: Figures in this article are calculated using data from the last twelve months, which refer to the 12-month period ending on the last date of the month the financial statement is dated. This may not be consistent with full year annual report figures.
Have feedback on this article? Concerned about the content?Get in touch with us directly. Alternatively, email editorial-team (at) simplywallst.com. This article by Simply Wall St is general in nature. We provide commentary based on historical data and analyst forecasts only using an unbiased methodology and our articles are not intended to be financial advice. It does not constitute a recommendation to buy or sell any stock, and does not take account of your objectives, or your financial situation. We aim to bring you long-term focused analysis driven by fundamental data. Note that our analysis may not factor in the latest price-sensitive company announcements or qualitative material. Simply Wall St has no position in any stocks mentioned.
Have feedback on this article? Concerned about the content? Get in touch with us directly. Alternatively, email editorial-team@simplywallst.com
オーストラリアでは、moomooの投資商品及びサービスはMoomoo Securities Australia Limitedによって提供され、オーストラリア証券投資委員会(ASIC)の管理を受けております(AFSL No. 224663)。「金融サービスガイド」、「利用規約」、「プライバシーポリシー」などの詳細は、Moomoo Securities Australia Limitedのウェブサイトhttps://www.moomoo.com/auでご確認いただけます。
オーストラリアでは、moomooの投資商品及びサービスはMoomoo Securities Australia Limitedによって提供され、オーストラリア証券投資委員会(ASIC)の管理を受けております(AFSL No. 224663)。「金融サービスガイド」、「利用規約」、「プライバシーポリシー」などの詳細は、Moomoo Securities Australia Limitedのウェブサイトhttps://www.moomoo.com/auでご確認いただけます。