If understood and applied correctly, technical analysis is a study of supply and demand and market psychology. Classic chart patterns are graphical illustrations of these dynamics.
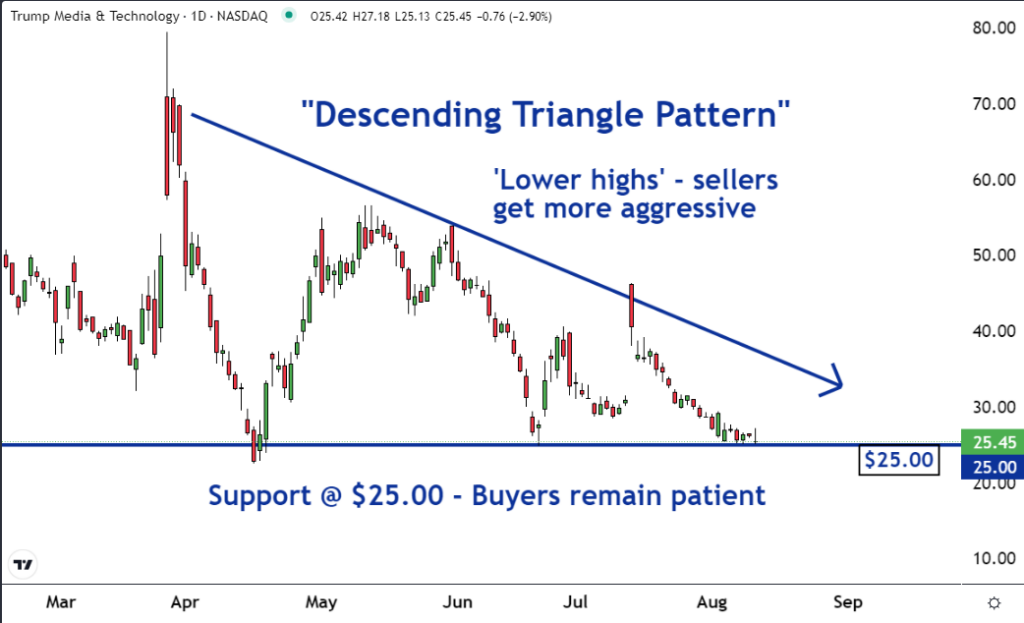
For example, a 'descending triangle' has formed on the chart of Trump Media & Technology Group Corp. (NASDAQ:DJT). This pattern typically has bearish implications and suggests that the price is about to move lower. This is why our team of expert traders and technical analysts have made it our 'Stock of the Day'.
A descending triangle shows that as time passes, buyers remain patient while sellers become increasingly aggressive. Regardless of the market, aggressive sellers and complacent or patient buyers can set the stage for a move South.
As you can see on the chart, the $25 level has been support for DJT since April. Each time the shares dropped to this price, buyers put a floor under it. This means that these buyers were willing to be patient and let the sellers come to them.
Read Also: What's Going On With Trump Media Stock On Monday?
The horizontal support line is an illustration of patient or complacent buyers.
As you can also see on the chart, the resistance line has been declining or descending since late March. This line illustrates a series of 'lower highs'.
It shows that as time has passed, the sellers have become increasingly aggressive. They have been willing to accept successively lower prices for their shares.
The descending resistance line is an illustration of aggressive sellers
When a stock reaches a support level, as DJT has done, traders and investors become curious as to whether the support will break and the shares will head lower, or if the support will hold and the shares will reverse and rally.
When there is a descending triangle pattern or series of lower highs in a trend before a stock reaches support, there is a good chance that the support breaks. The aggressive sellers will overpower the patient buyers. This will force the price lower.
There is a good chance that shares of DJT are about to enter a new downtrend.
- Markets Experience Best And Worst Days Since 2022: What's Next In Wall Street's Rollercoaster Ride?
Photo: Shutterstock
テクニカル分析は、供需と市場心理の研究であるため、正しく理解し応用すれば、古典的なチャートパターンはこれらのダイナミクスのグラフィカルな表現です。
たとえば、トランプ・メディア・アンド・テクノロジー・グループ・コーポレーション(NASDAQ: DJT)のチャートに「下降三角形」が形成されています。このパターンは通常、弱気の意味を持ち、価格が下がることを示唆しています。これが私たちのエキスパートトレーダーと技術分析家チームが「本日の銘柄」として取り上げた理由です。
下降三角形は、時間が経つにつれて、購入者が忍耐強く、売却者がますます攻撃的になることを示します。市場に関係なく、攻撃的な売り手と満足または忍耐強い買い手は、南に向かうための舞台を設定できます。
チャートを確認すると、4月以来、$25レベルがDJtのサポートになっています。株価がこの価格に下がるたびに、買い手は床に置きます。これは、これらの買い手が忍耐強く、売り手に接触することを望んでいたことを意味します。
読者も興味をもつかもしれません: 月曜日のトランプメディア株に何が起こっているのか?
水平サポートラインは、忍耐強いまたは満足な買い手の一例です。
また、チャートで確認できるように、レジスタンスラインは3月下旬以降、下降しています。このラインは「低い高値」の連続を示しています。
これにより、時間が経つにつれて、売り手はますます攻撃的になっています。彼らは、株式を相次いで低い価格で売却することを承知しています。
下降レジスタンスラインは、攻撃的な売り手の表現です
DJtのように、株価がサポートレベルに達すると、トレーダーや投資家は、サポートが壊れ、株価が下落するか、サポートが維持され、株価が反転して上昇するかについて興味を抱くようになります。
株価がサポートに到達する前のトレンドで、下降三角形のパターンまたは連続する高値がある場合、サポートが破られる可能性が高くなります。攻撃的な売り手は、忍耐強い買い手を圧倒します。これにより、価格は低下します。
DJtの株式が新しい下降トレンドに入る可能性が高いです。
- 2022年以来、市場は最高と最低の日を経験:ウォールストリートのジェットコースターライドの次は何ですか?
写真:シャッターストック