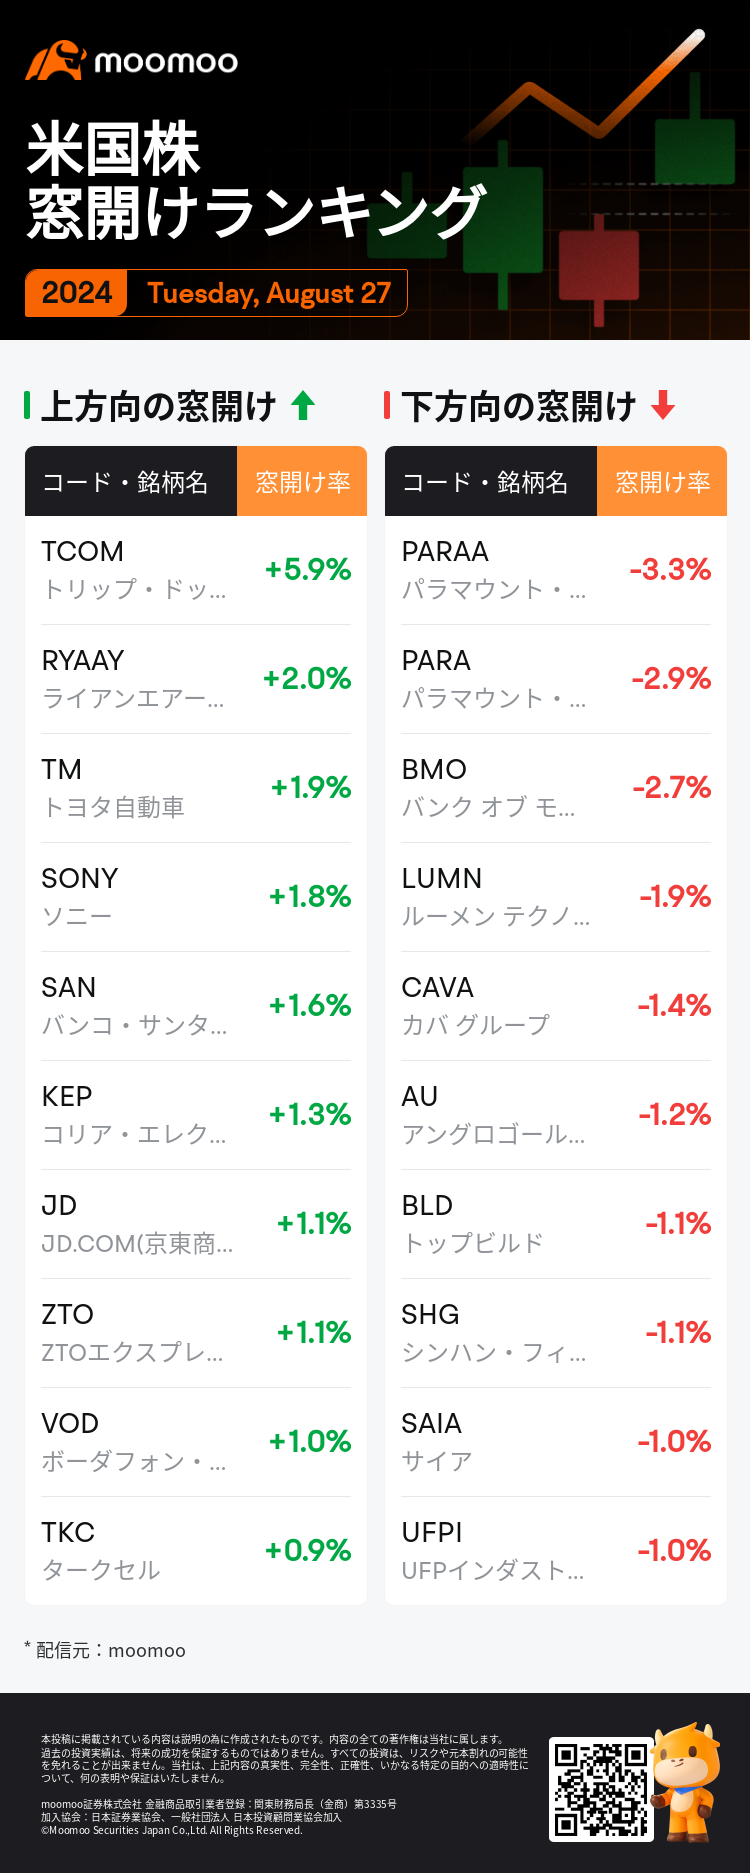
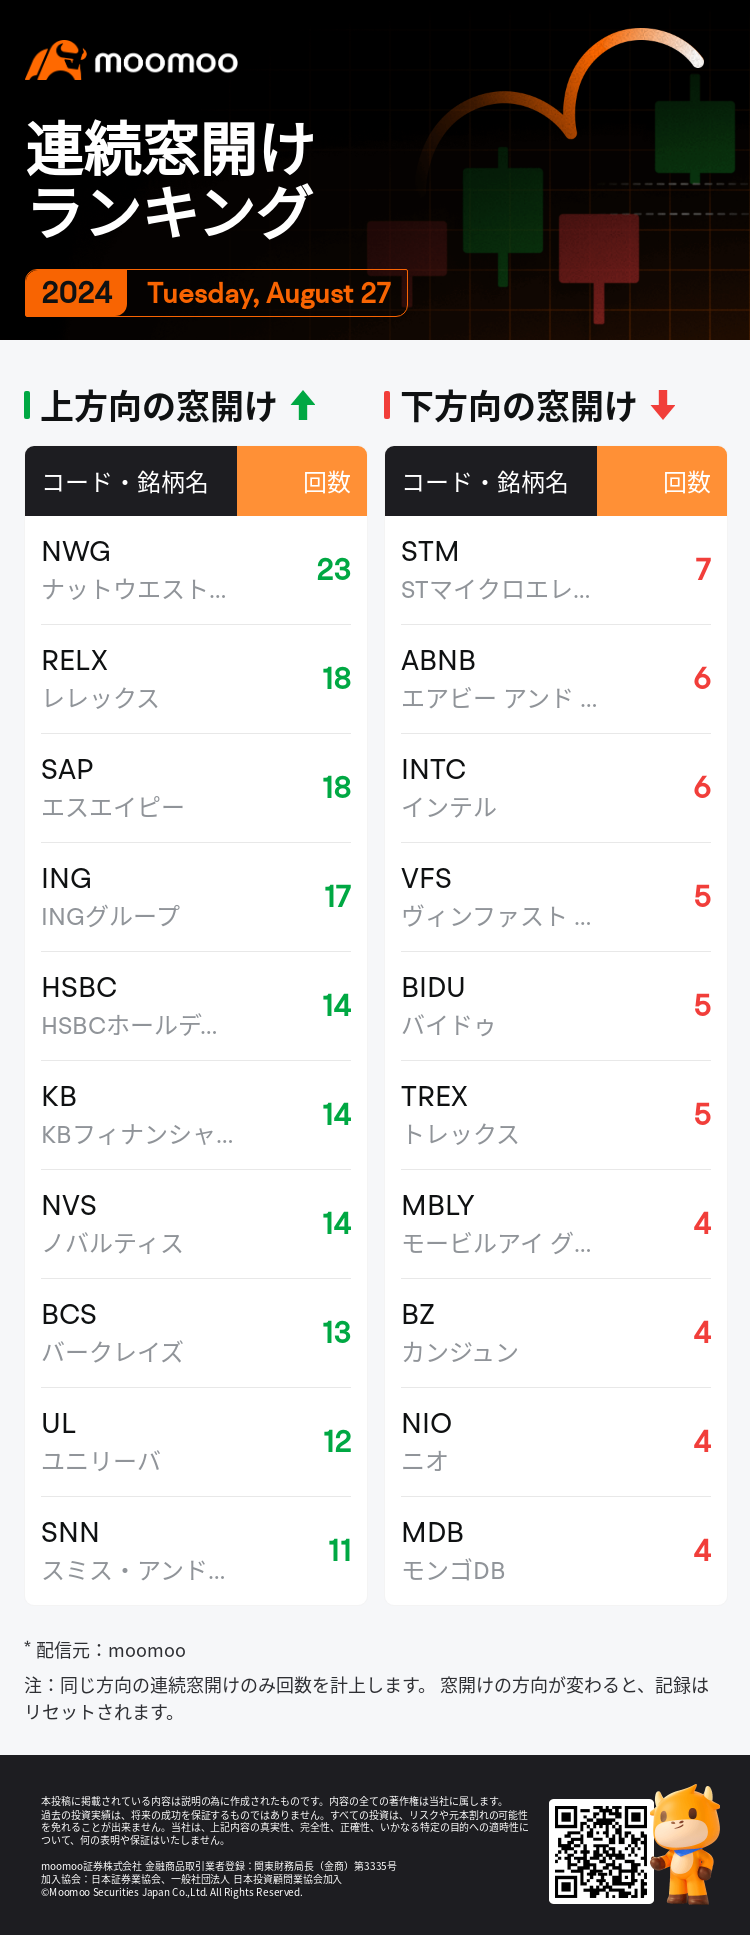
Here are the top 3 gap ups and downs for the stocks with a market cap above $5 billion after the market closed (gaps range from large to small):
Gap Ups
1. $Trip.com (TCOM.US)$ +5.9%
 2. $Ryanair (RYAAY.US)$ +2.0%
3. $Toyota Motor (TM.US)$ +1.9%
Gap Downs
1. $Paramount Global-A (PARAA.US)$ -3.3%
2. $Paramount Global-B (PARA.US)$ -2.9%
3. $Bank of Montreal (BMO.US)$ -2.7%
![]()
What are gaps?
Price charts sometimes have blank spaces known as gaps (up gaps and down gaps), where the price of a stock moves sharply up or down, with little or no shares traded in between. This is why the asset's chart shows a gap in the normal price pattern. Normally this occurs between the close of the market on one day and the next day's open.
For an up gap, the low price of the day must be higher than the high price of the previous day. A down gap is just the opposite of an up gap.
Gaps can show signals that something important has happened to the fundamental or the psychology of traders that accompanies this market movement.
For example, if an unexpectedly high earnings report comes out after the market has closed for the day, a lot of buying interest could be generated overnight, leading to an imbalance between supply and demand. When the market opens the next morning, the stock price will likely rise in response to the increased demand from buyers. If the stock price remains above the previous day's high throughout the day, then an up gap is formed.


窓(ギャップ)とは
 窓(ギャップ)とは、株価の急激な値動きにより、前日のローソク足と当日のローソク足との間にできた空間のことをいう。つまり、ローソク足とローソク足の間に値を付けていない価格帯を指す。株価に影響を及ぼす何らかの材料が出たことを受けて、株価チャートに窓が出現するのが一般的である。
上方向に窓が開くことを上方向の窓開け(ギャップアップ)、下方向に窓が開くことを下方向の窓開け(ギャップダウン)と表現する。上方向の窓開け、つまり前日の高値を上回った水準で始まり、当日の安値が前日の高値を下回らない水準を保ったまま引けることである。下方向の窓開けはその逆である。
窓(ギャップ)は株価の方向性や市場の動向、投資家心理の変化を示唆する大事なサインでもある。
例えば、大引け後に企業が好決算を発表し、投資家に好感を持たれた場合、翌日の寄り付きは買い注文が殺到することにより、売り注文が出にくいため、高く寄り付くことになる。そして前日の高値を上回った水準を保ったまま引けると上方向の窓開け(ギャップアップ)になる。
 窓(ギャップ)とは、株価の急激な値動きにより、前日のローソク足と当日のローソク足との間にできた空間のことをいう。つまり、ローソク足とローソク足の間に値を付けていない価格帯を指す。株価に影響を及ぼす何らかの材料が出たことを受けて、株価チャートに窓が出現するのが一般的である。


 2.
2. 


