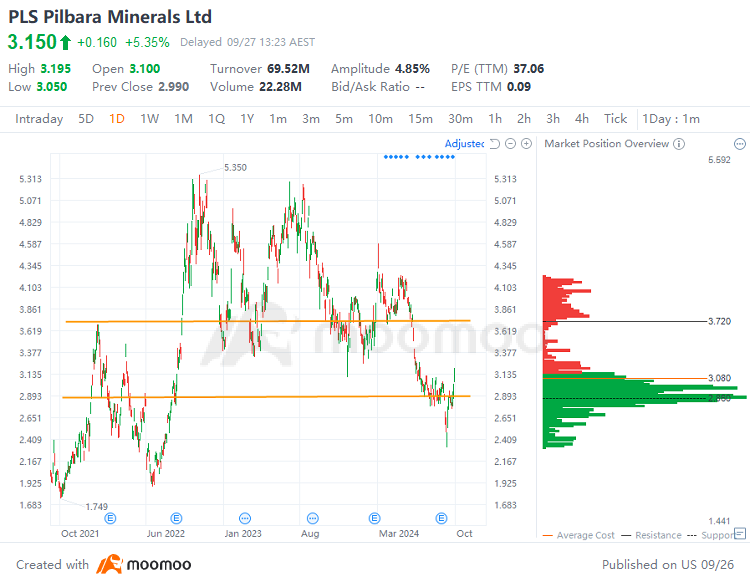
$Pilbara Minerals Ltd (PLS.AU)$ stock jumped 5.35% on Friday, with trading volume expanding to A$69.52 million. Pilbara has risen 10.07% in the past week, with a cumulative loss of 19.75% year-to-date.
Pilbara's technical analysis chart:
Technical Analysis:
 Support: A$2.86
Resistance: A$3.72
Price range A$2.86 to A$3.72: The trading range indicates a heavy concentration of buy orders, with the stock price on an upward trend and strong upward momentum. The trading range suggests a sparse distribution of locked-in positions, leading to reduced resistance to upward price movement. The stock price bounced back after finding support near A$2.86. It repeatedly touched around A$3.72, establishing a level of resistance that impedes further upward movement. There are also some trapped positions around A$3.72, and it is necessary to observe whether the resistance level near A$3.72 can be effectively broken through.
Market News :
Pilbara released its FY2024 results at the end of August, with a 69% decline in revenue to A$1.254 billion. This decrease was primarily attributed to the downward trend in lithium prices. During the reporting period, the company's average estimated realized price for spodumene concentrate dropped by 74% to A$1,762 per dry metric tonne (CIF China) on a ~SC5.3 basis. As for profit, Pilbara's EBITDA of A$538 million was 84% lower than the same period last year, mainly due to lower realized prices. However, lower total costs and higher sales volumes partially offset this decline. The EBITDA margin remained strong at 43% for the period. The underlying profit after tax and statutory profit after tax also experienced significant decreases of 86% and 89% respectively.
Previously, the reduction in supply from CATL was expected to drive up the price of lithium mines, leading to a rebound in stock prices. Recently, Australian mining stocks are likely to benefit from China's economic stimulus measures, with shares continuing to rise.
Overall Analysis:
Fundamentally, focus on the company's performance and operational status, as well as the fluctuations in lithium ore prices. Technically, pay attention to whether the support levels hold and if the resistance levels can be effectively breached.
In this scenario, investors should adopt a cautious strategy, setting stop-loss points to manage risk and maintaining ongoing vigilance regarding company developments and market conditions.
Source: Pilbara, Bloomberg
$Pilbara Minerals Ltd (PLS.AU)$ 金曜日に株価は5.35%上昇し、取引高はA$6952万に拡大しました。ピルバラは先週に10.07%上昇し、今年初の累積損失率は19.75%です。
ピルバラのテクニカル分析チャート:
テクニカル分析:
 レジスタンス: A$3.72
サポート: A$2.86
価格範囲 A$2.86からA$3.72: 取引範囲は買い注文が重点的に集中し、株価は上昇トレンドで強い上昇勢いを示しています。 取引範囲はロックインポジションがまばらに分布しており、上昇価格動向への抵抗が減少しています。 株価はA$2.86付近でサポートを見つけた後、反発しました。A$3.72付近で繰り返しタッチし、上方移動を妨げるレベルのレジスタンスを確立しました。 A$3.72付近に困っているポジションもいくつかあり、A$3.72付近のレジスタンスレベルが効果的に突破できるかどうかを観察する必要があります。
ニュース:
8月末にパイルバラは2024会計年度の決算を発表し、売上高がA$12.54億に減少したことが報告されました。 この減少は主にリチウム価格の下降トレンドに帰因しています。 報告期間中、スポジューメンの濃縮物の平均推定実現価格は、SC5.3基準でドライメトリックトン当たりA$1,762に74%減少しました。 利益に関して、パイルバラのEBITDAはA$53800万で、前年同期比で84%低下し、主に実現価格が下がったためです。 ただし、全体コストの低減と販売数量の増加がこの低下を部分的に相殺しました。 期間中のEBITDAマージンは43%の強固な水準を維持していました。 法人税前利益と法人税後純利益もそれぞれ86%、89%の大幅な減少を経験しました。
CATLからの供給削減がリチウム鉱山の価格を押し上げ、株価の反発につながると予想されていました。最近、中国の景気刺激策からオーストラリアの鉱業株が恩恵を受ける可能性が高く、株価は引き続き上昇する見込みです。
総合分析:
基本的には、企業の業績や稼働状況、リチウム鉱石の価格変動に焦点を当てます。技術的には、サポートレベルが保持されるかどうか、そしてレジスタンスレベルが効果的に破られるかどうかに注意してください。
このシナリオでは、投資家は慎重な戦略を採用するべきであり、リスクを管理するためにストップロスポイントを設定し、企業の動向や市場状況について継続的な警戒を保つべきです。
出典: Pilbara、Bloomberg

 レジスタンス: A$3.72

 Support: A$2.86