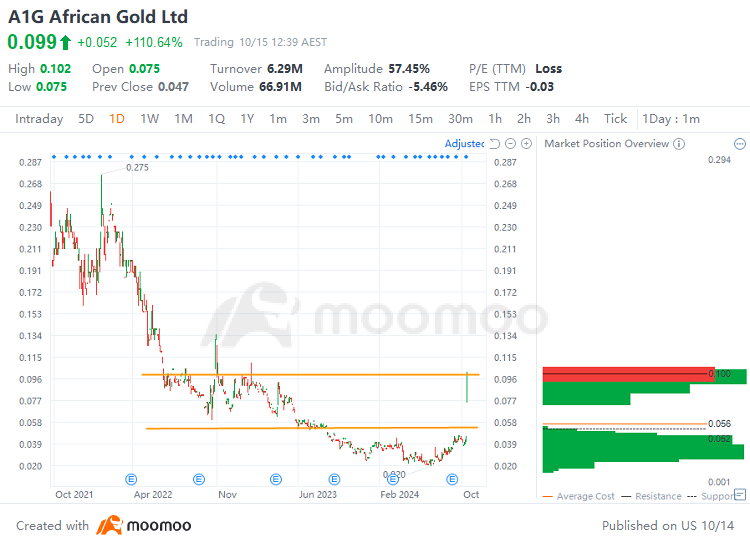
$African Gold Ltd (A1G.AU)$ stock soared 110.64%% on Tuesday, with trading volume expanding to A$6.29 million. African Gold has risen 160% in the past week, with a cumulative loss of 266.67% year-to-date.
African Gold's technical analysis chart:
Technical Analysis:
 Support: A$0.052
Resistance: A$0.1
Price range A$0.052 to A$0.1: The trading range indicates a heavy concentration of buy orders, with the stock price on an upward trend and strong upward momentum. The trading range has a low concentration of trapped positions, resulting in reduced resistance to upward price movement. A significant amount of profit-taking is present within the trading range, with considerable selling pressure noted around the A$0.1 level. Be cautious of the risk associated with potential selling of these positions.
Market News :
African Gold announced the results from the recently completed DDD049 diamond drillhole. The assay results from DDD049 have returned a spectacular, thick, high-grade gold intersection of 65.0m at 5.6 g/t of gold from 177m, confirming distribution of the gold mineralisation an additional 85m along the southwesterly plunging high-grade gold trend. The mineralisation (lode 178) remains open at depth. This is a good sign for future drilling and suggests that the mineral resource is much larger than the inferred amount.
The company also announced the appointment of Mr. Adam Oehlman as Chief Executive Officer. Mr. Oehlman is an experienced mining professional with a strong technical and corporate background, having held senior roles at some of the world's largest resource companies.
Overall Analysis:
Fundamentally, focus on the company's performance and operational status. Technically, pay attention to the selling pressure near the A$0.1.
In this scenario, investors should adopt a cautious strategy, setting stop-loss points to manage risk and maintaining ongoing vigilance regarding company developments and market conditions.
$African Gold Ltd (A1G.AU)$ 火曜日に株価が110.64%%急騰し、取引出来高はA$629万に拡大しました。アフリカン・ゴールドは過去1週間で160%上昇し、年初来の累積損失は266.67%です。
アフリカン・ゴールドのテクニカル分析チャート:
テクニカル分析:
 レジスタンス: A$0.1
サポート: A$0.052
A$0.052からA$0.1の価格範囲: この取引範囲は買い注文が集中しており、株価は上昇トレンドにあり強い上昇勢を示しています。取引範囲には取り残されたポジションが少なく、上昇する価格に対する反発が少なくなります。取引範囲内にはかなりの利益確定があり、A$0.1付近でかなりの売り圧力が見られます。これらのポジションの売却リスクに注意してください。
ニュース:
アフリカン・ゴールドは、最近完了したDDD049ダイヤモンドドリルホールからの結果を発表しました。 DDD049からの試験結果は、ゴールドの豊富な6500万atで、深い5.6 g/tのゴールドの交差部分を17700万地点から返し、南西に傾斜する高品位ゴールドの傾向に沿って追加の8500万までの分布を確認しました。鉱化(ロード178)は深さにおいては未だオープン状態です。これは将来の掘削に良い兆候であり、鉱物資源が推定数量よりもはるかに大きいことを示唆しています。
会社はまた、Adam Oehlman氏を最高経営責任者として任命したことを発表しました。Oehlman氏は、世界最大の資源会社のいくつかで重要な役職を務めた経験豊富な採掘専門家であり、強力な技術と企業のバックグラウンドを持っています。
総合分析:
基本的には、会社の業績と運営状況に焦点を当てます。技術的には、A$0.1近くでの売り圧に注意してください。
このシナリオでは、投資家は慎重な戦略を採用するべきであり、リスクを管理するためにストップロスポイントを設定し、企業の動向や市場状況について継続的な警戒を保つべきです。

 レジスタンス: A$0.1

 Support: A$0.052