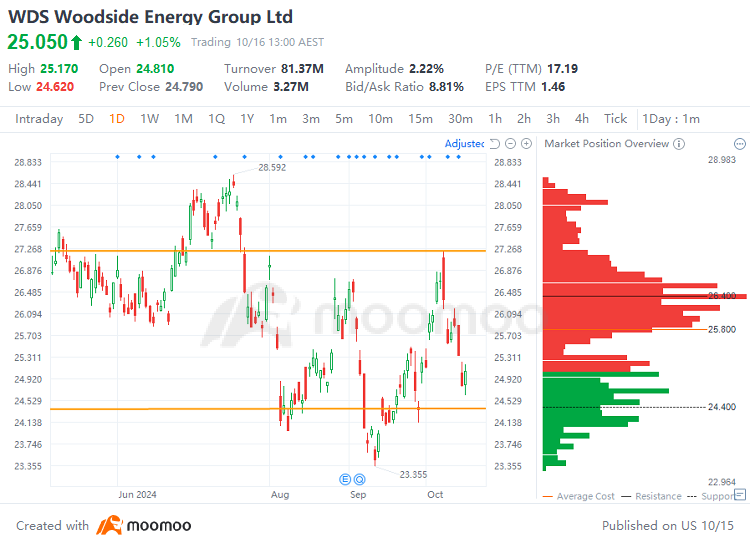
$Woodside Energy Group Ltd (WDS.AU)$ stock rose 1.05% on Wednesday, with trading volume expanding to A$81.37 million. Woodside has fallen 5.32% in the past week, with a cumulative loss of 11.81% year-to-date.
Woodside's technical analysis chart:
Technical Analysis:
 Support: A$24.4
Resistance: A$27.2
Price range A$24.4 to A$27.2: The trading range indicates a high concentration of sell orders, with the stock price exhibiting a short-term downward trend. There is a significant amount of trapped capital within the trading range, which creates substantial resistance to price increases. The stock price declined near the resistance level of around A$27.2, and it repeatedly touched near the level of A$24.4, forming a certain support. Going forward, we need to observe whether the support at around A$24.4 holds and whether the resistance at around A$27.2 can be effectively breached.
Market News :
Woodside announced its Q3 2024 results on October 16, 2024, reporting record-breaking production fueled by Sangomar. The company achieved a record quarterly production of 53.1 MMboe (577 Mboe/day), a 20% increase from Q2 2024, primarily due to the ramp-up at Sangomar. This production figure surpassed the consensus estimate of 50.1 MMboe. Additionally, the company reported quarterly revenue of US$3.679 billion, which is a 21% increase from Q2 2024, mainly due to Sangomar cargo sales and higher average LNG prices.
Woodside reviewed its current listing structure and decided to delist from the London Stock Exchange (LSE). Woodside shares represented by depositary interests account for approximately 1% of Woodside’s issued share capital. Trading volumes of Woodside shares on the LSE are low and delisting from the LSE will reduce Woodside’s administration costs.
Overall Analysis:
Fundamentally, focus on the company's performance and operational status. Technically, pay attention to whether the support levels hold and if the resistance levels can be effectively breached.
In this scenario, investors should adopt a cautious strategy, setting stop-loss points to manage risk and maintaining ongoing vigilance regarding company developments and market conditions.
$Woodside Energy Group Ltd (WDS.AU)$ 水曜日に株価は1.05%上昇し、取引量はA$8137万に拡大しました。ウッドサイドは先週5.32%下落し、累計で11.81%の損失を計上しています。
ウッドサイドのテクニカル分析チャート:
テクニカル分析:
 サポート: A$24.4
レジスタンス: A$27.2
A$24.4からA$27.2までの価格帯:取引範囲は売り注文が集中しており、株価は短期的な下降トレンドを示しています。取引範囲内に多額の資本が閉じ込められているため、価格上昇に対して重要なレジスタンスが生じています。株価はA$27.2付近のレジスタンスレベルで下落し、繰り返しA$24.4レベル付近に接触しており、ある程度のサポートが形成されています。今後は、A$24.4付近のサポートが維持されるか、A$27.2付近のレジスタンスが効果的に突破されるかを観察する必要があります。
ニュース:
Woodsideは2024年10月16日に2024年第3四半期の業績を発表し、サンゴマールによって牽引される記録的な生産を報告しました。同社は1日あたり577Mboeの記録的な四半期生産量を達成し、前四半期の2024年第2四半期から20%増加しました。これは、主にサンゴマールの立ち上げによるものです。この生産数は、50.1MMboeのコンセンサス予想を上回りました。さらに、同社は四半期売上高が36.79億米ドルであり、これは2024年第2四半期から21%増加しており、主にサンゴマールの貨物販売と平均LNG価格の上昇によるものです。
Woodsideは現在のリスティング構造を見直し、ロンドン証券取引所(LSE)から上場廃止することを決定しました。ドポジトリ ・ インタレストで代表されるWoodsideの株式は、Woodsideの発行済み株式資本の約1%を占めます。 LSEでのWoodside株取引量は低いため、LSEからの上場廃止はWoodsideの管理コストを軽減します。
総合分析:
基本的には、会社のパフォーマンスと運用状況に注目してください。技術的には、サポートレベルが保たれており、抵抗レベルが効果的に突破できるかどうかに注意してください。
このシナリオでは、投資家は慎重な戦略を採用するべきであり、リスクを管理するためにストップロスポイントを設定し、企業の動向や市場状況について継続的な警戒を保つべきです。

 サポート: A$24.4

 Support: A$24.4