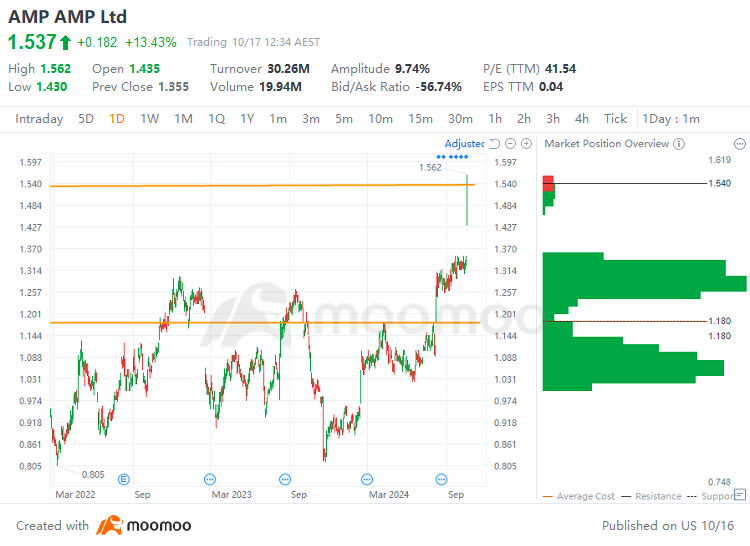
$AMP Ltd (AMP.AU)$ stock rose 13.43% on Thursday, with trading volume expanding to A$30.26 million. AMP has risen 14.7% in the past week, with a cumulative gain of 70.88% year-to-date.
AMP's technical analysis chart:
Technical Analysis:
 Support: A$1.18
Resistance: A$1.54
Price range A$1.18 to A$1.54: The trading range indicates a heavy concentration of buy orders, with the stock price on an upward trend and strong upward momentum. However, there is a risk of profit-taking as some gains have been accumulated. The stock had found support near the A$1.18. Currently, the stock is near the upper resistance level of near the A$1.54. Going forward, it is necessary to observe whether the resistance near A$1.54 can be effectively broken through.
Market News :
AMP released its Q3 24 cashflows and business update on October 17, 2024. The report highlighted several positive financial indicators: Platforms net cashflows reached A$750 million, marking a 76% increase from Q3 23. Notably, North inflows from Independent Financial Advisers (IFAs) saw a significant surge, increasing by 47% compared to Q3 23, to reach A$832 million. The Platforms Assets Under Management (AUM) also showed robust growth, climbing to A$78.1 billion, up from A$74.7 billion in Q2 24. In the Superannuation & Investments sector, AUM rose to A$55.8 billion, from A$54.0 billion in Q2 24, with net cash outflows significantly reduced by 46% to A$334 million, compared to net cash outflows of A$619 million in Q3 23, excluding a A$4.3 billion mandate loss. The New Zealand Wealth Management division reported net cashflows of A$40 million, up from A$6 million in Q3 23, with AUM increasing to A$11.6 billion, from A$11.2 billion in Q2 24. Lastly, AMP Bank reported a total loan book of A$23.0 billion, slightly up from A$22.9 billion in Q2 24, and total deposits increased to A$20.9 billion, from A$20.6 billion in Q2 24.
Overall Analysis:
Fundamentally, focus on the company's performance and operational status. Technically, pay attention to whether the support levels hold and if the resistance levels can be effectively breached.
In this scenario, investors should adopt a cautious strategy, setting stop-loss points to manage risk and maintaining ongoing vigilance regarding company developments and market conditions.
Source: AMP
$AMP Ltd (AMP.AU)$ 木曜日に株が13.43%上昇し、取引高はA$3026万まで拡大しました。AMPは過去1週間で14.7%上昇し、年初来の累積利益率は70.88%になりました。
AMPのテクニカル分析チャート:
テクニカル分析:
 レジスタンス: A$1.18
サポート: A$1.54
価格範囲 A$1.18からA$1.54: 取引範囲は多くの買い注文が集中しており、株価は上昇トレンドにあり強い上昇勢力があります。しかし、一部の利益が蓄積されており利益確定リスクがあります。株はA$1.18付近でサポートを見つけました。現在、株はA$1.54付近の上位レジスタンスレベルにあります。今後は、A$1.54付近のレジスタンスが効果的に突破されるかどうかを観察する必要があります。
ニュース:
AMPは2024年10月17日に第3四半期のキャッシュフローと事業の最新情報を発表しました。報告書では、いくつかのポジティブな財務指標が強調されました。プラットフォームの純キャッシュフローはA$75000万に達し、第3四半期23年から76%増加しました。特筆すべきは、IFAs(独立系金融アドバイザー)からのノースの流入が大幅に増加し、第3四半期23年と比較して47%増加し、A$83200万に達しました。プラットフォームの運用資産(AUM)も堅調な成長を示し、第2四半期24年のA$74.7億からA$781億に上昇しました。サーパーナンエイション&インベストメントセクターでは、AUMは第2四半期24年のA$540億からA$558億に増加し、純現金流出が大幅に46%減少してA$33400万に抑えられましたが、43億ドルの委任損失を除く。ニュージーランドのウェルスマネジメント部門は、第3四半期23年のA$6,000万からA$4,000万に増加し、AUMは第2四半期24年のA$11.2億からA$116億に増加しました。最後に、AMP BankはA$230億の総融資残高を報告し、第2四半期24年のA$229億からわずかに上昇し、総預金も第2四半期24年のA$206億からA$209億に増加しました。
総合分析:
基本的には、会社のパフォーマンスと運用状況に注目してください。技術的には、サポートレベルが保たれており、抵抗レベルが効果的に突破できるかどうかに注意してください。
このシナリオでは、投資家は慎重な戦略を採用するべきであり、リスクを管理するためにストップロスポイントを設定し、企業の動向や市場状況について継続的な警戒を保つべきです。
ソース:AMP

 レジスタンス: A$1.18

 Support: A$1.18