Welcome to the Daily Gap column!
In the realm of technical analysis, gaps are often viewed as critical indicators of potential price movements. Particularly those that emerge at market open, these gaps can signify dramatic shifts in market sentiment. The directionality of these gaps provides traders with insights into short-term trends, allowing them to develop corresponding trading strategies.
Here is the showcase of the top 10 stocks with the largest gap sizes as of yesterday's close. The "Gap %chg" metric indicates the magnitude of these gaps, with all included stocks reaching a market capitalization of $5 billion.
 Additionally, we highlight stocks that have exhibited the longest streak of consecutive gaps in either up or down direction over the past 250 trading days. These stocks are also filtered with the same market capitalization criterion.
Technical traders believe that gaps can provide directional clues, but the accuracy of a single indicator is not sufficient to predict stock movements. Investors still need to incorporate various factors, including board market sentiment, company fundamental factors, technical indicators, and so on.
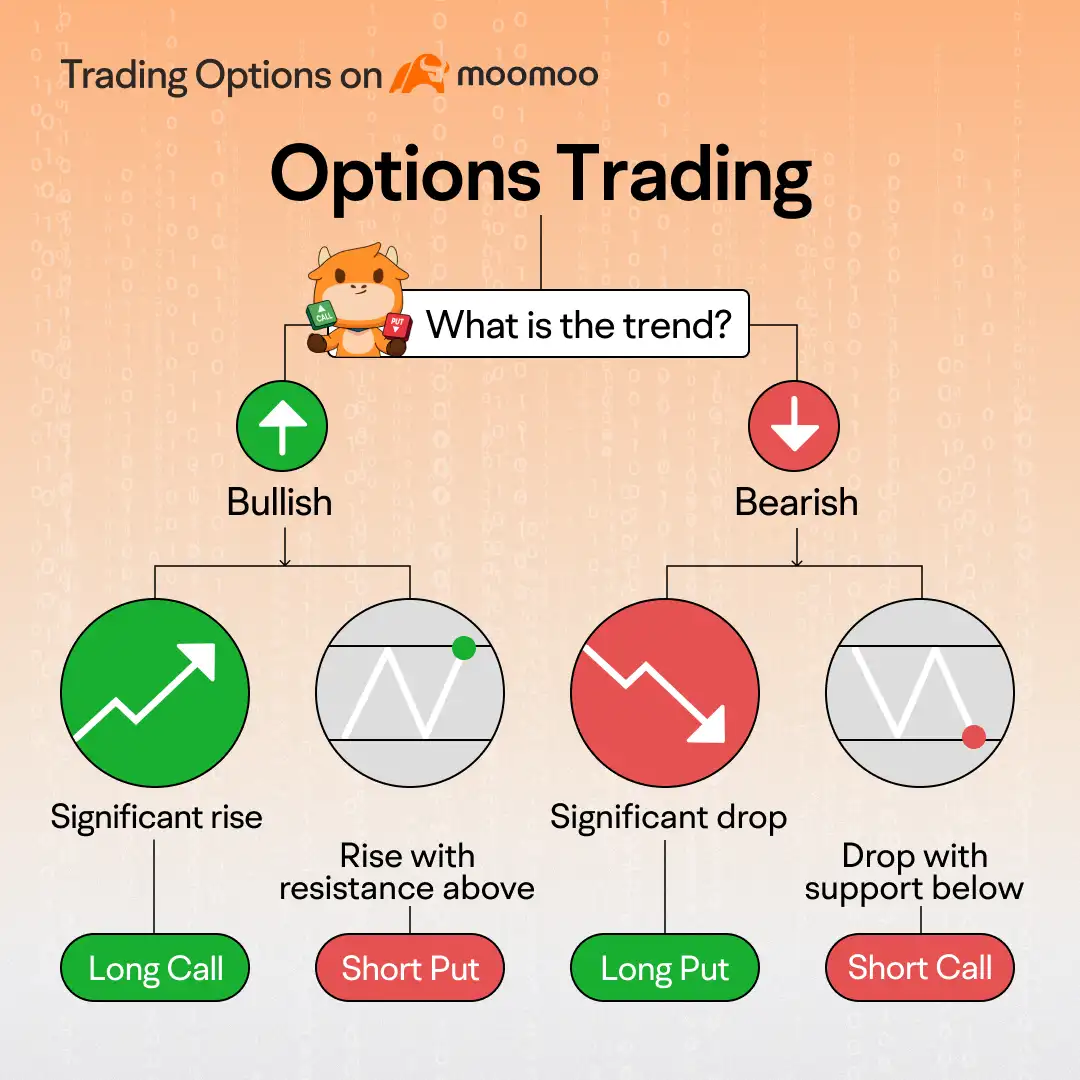
Options strategies can be an effective way to capitalize on anticipated price movements in different trending scenarios.

For investors optimistic about a stock's upward trajectory, some commonly utilized options strategies include the Long Call, the Bull Call Spread, and the Cash-Secured Put, each with different risk levels.
The Long Call involves purchasing a call option, limiting risk to the premium paid while offering potentially unlimited profit if the stock rises. The Bull Call Spread is a more conservative approach, where investors buy a call at a lower strike and sell another at a higher strike, reducing costs and capping both gains and losses. Alternatively, the Cash-Secured Put involves selling a put option while holding enough cash to buy the stock at the strike price if assigned, allowing investors to potentially acquire the stock at a discount while generating premium income.
For investors anticipating a downward trend in a stock, several options strategies can be employed, each with varying risk levels.
The Long Put strategy involves purchasing a put option, granting the right to sell the stock at a specified strike price before expiration. This strategy offers significant profit potential if the stock price declines, with risk limited to the premium paid for the option. The Bull Put Spread combines selling a put option at a higher strike price while simultaneously buying another put option at a lower strike price, allowing traders to collect premium income while capping potential losses, thus providing a more balanced risk-reward profile. Another strategy is the Short Call, where an investor sells a call option, obligating them to sell the stock at the strike price if the option is exercised. While this can yield profits if the stock price falls, it carries unlimited risk if the stock rises sharply, making it more suitable for experienced traders who can manage the associated risks effectively.
What are gaps?
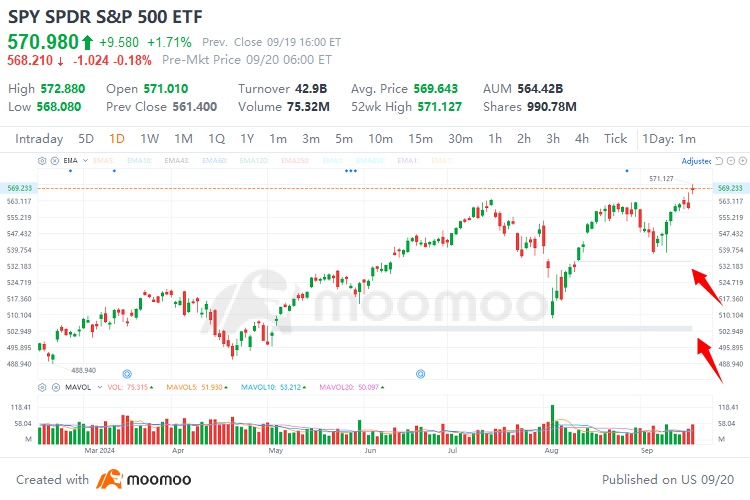
Price charts sometimes have blank spaces known as gaps (up gaps and down gaps), where the price of a stock moves sharply up or down, with little or no shares traded in between. This is why the asset's chart shows a gap in the normal price pattern. Normally this occurs between the close of the market on one day and the next day's open.
For an up gap, the low price of the day must be higher than the high price of the previous day. A down gap is just the opposite of an up gap.
Gaps can show signals that something important has happened to the fundamental or the psychology of traders that accompanies this market movement.
For example, if an unexpectedly high earnings report comes out after the market has closed for the day, a lot of buying interest could be generated overnight, leading to an imbalance between supply and demand. When the market opens the next morning, the stock price will likely rise in response to the increased demand from buyers. If the stock price remains above the previous day's high throughout the day, then an up gap is formed.


Disclaimer: Options trading entails significant risk and is not appropriate for all customers. It is important that investors read Characteristics and Risks of Standardized Options (https://j.moomoo.com/017y9J) before engaging in any options trading strategies. Options transactions are often complex and may involve the potential of losing the entire investment in a relatively short period of time. Certain complex options strategies carry additional risk, including the potential for losses that may exceed the original investment amount. Supporting documentation for any claims, if applicable, will be furnished upon request.
窓(ギャップ)とは
 窓(ギャップ)とは、株価の急激な値動きにより、前日のローソク足と当日のローソク足との間にできた空間のことをいう。つまり、ローソク足とローソク足の間に値を付けていない価格帯を指す。株価に影響を及ぼす何らかの材料が出たことを受けて、株価チャートに窓が出現するのが一般的である。
上方向に窓が開くことを上方向の窓開け(ギャップアップ)、下方向に窓が開くことを下方向の窓開け(ギャップダウン)と表現する。上方向の窓開け、つまり前日の高値を上回った水準で始まり、当日の安値が前日の高値を下回らない水準を保ったまま引けることである。下方向の窓開けはその逆である。
窓(ギャップ)は株価の方向性や市場の動向、投資家心理の変化を示唆する大事なサインでもある。
例えば、大引け後に企業が好決算を発表し、投資家に好感を持たれた場合、翌日の寄り付きは買い注文が殺到することにより、売り注文が出にくいため、高く寄り付くことになる。そして前日の高値を上回った水準を保ったまま引けると上方向の窓開け(ギャップアップ)になる。

