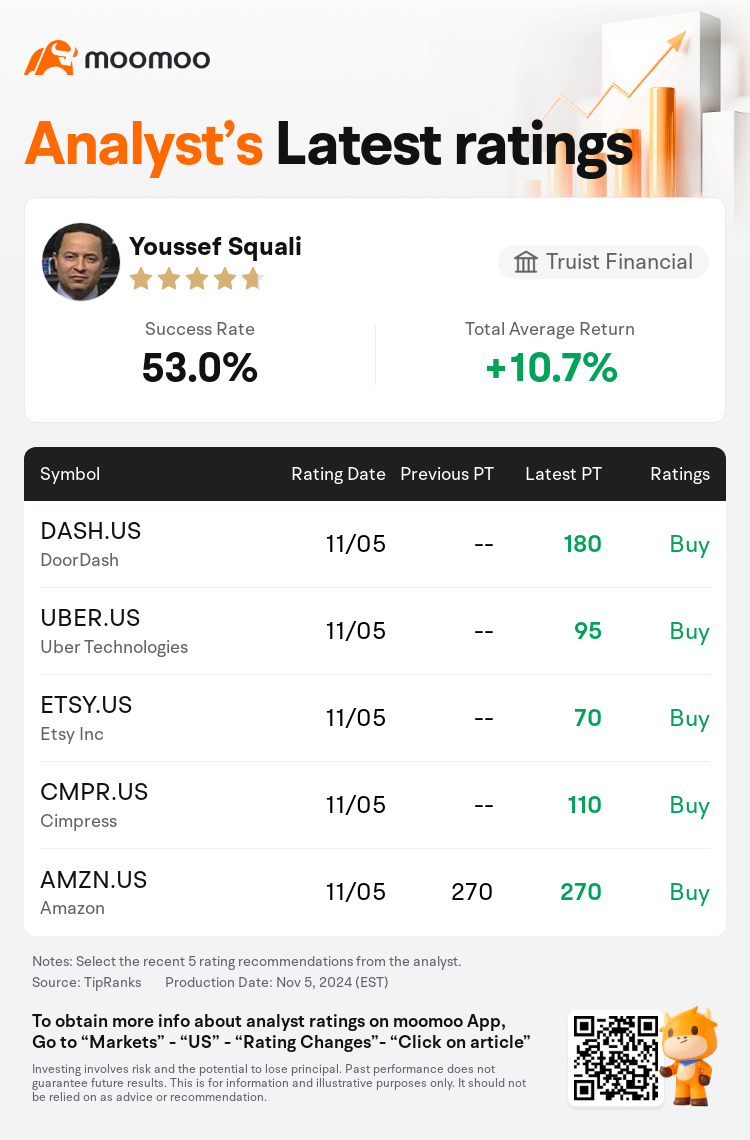
Truist Financial analyst Youssef Squali maintains $Peloton Interactive (PTON.US)$ with a hold rating, and sets the target price at $10.
According to TipRanks data, the analyst has a success rate of 53.0% and a total average return of 10.7% over the past year.

 Furthermore, according to the comprehensive report, the opinions of $Peloton Interactive (PTON.US)$'s main analysts recently are as follows:
Peloton's fiscal Q1 outcomes surpassed expectations, with Connected Fitness subscriptions, revenue, and adjusted EBITDA all exceeding the company's projected range. Despite these positive results, the unchanged fiscal 2025 revenue forecasts indicate ongoing challenges within the subscriber base and an uncertain trajectory towards growth.
Peloton's fiscal Q1 results surpassed expectations with a significant EBITDA that was higher than anticipated. The company's updated guidance for FY25 suggests EBITDA could reach between $240M-$290M, which is above the current Street consensus of $232M. It's believed that Peloton has the potential to surpass $300M in EBITDA this year and could possibly achieve over $400M in the coming years.
The emphasis on profitability over growth by Peloton has been a point of focus, with the latest quarterly results reinforcing this strategic pivot. Continued dedication to this profitability-centric approach is perceived to hold significant potential for EBITDA improvement, though concerns remain regarding possible risks if the company shifts back to prioritizing growth.
Note:
TipRanks, an independent third party, provides analysis data from financial analysts and calculates the Average Returns and Success Rates of the analysts' recommendations. The information presented is not an investment recommendation and is intended for informational purposes only.
Success rate is the number of the analyst's successful ratings, divided by his/her total number of ratings over the past year. A successful rating is one based on if TipRanks' virtual portfolio earned a positive return from the stock. Total average return is the average rate of return that the TipRanks' virtual portfolio has earned over the past year. These portfolios are established based on the analyst's preliminary rating and are adjusted according to the changes in the rating.
TipRanks provides a ranking of each analyst up to 5 stars, which is representative of all recommendations from the analyst. An analyst's past performance is evaluated on a scale of 1 to 5 stars, with more stars indicating better performance. The star level is determined by his/her total success rate and average return.
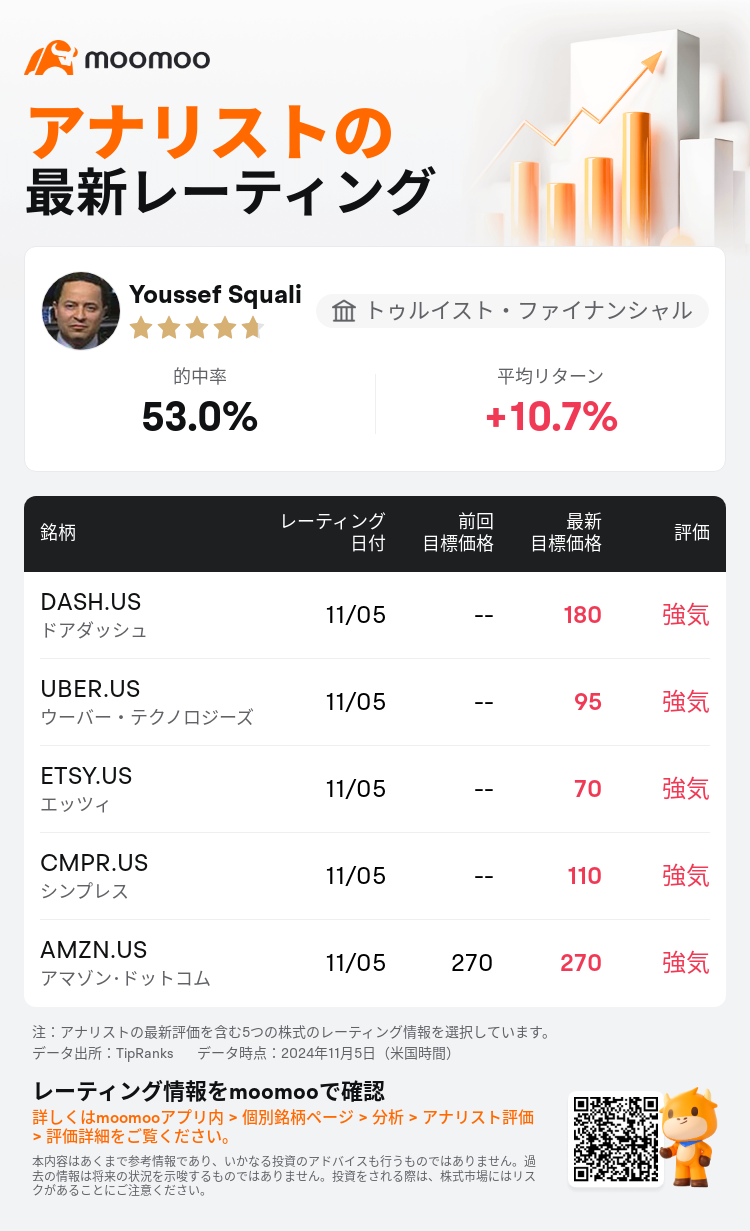
トゥルイスト・ファイナンシャルのアナリストYoussef Squaliは$ペロトン・インタラクティブ (PTON.US)$のレーティングを中立に据え置き、目標株価を10ドルにした。
TipRanksのデータによると、このアナリストの最近1年間の的中率は53.0%、平均リターンは10.7%である。

 また、$ペロトン・インタラクティブ (PTON.US)$の最近の主なアナリストの観点は以下の通りである:
Pelotonの第1四半期の業績は予想を上回り、コネクテッドフィットネスのサブスクリプション、収益、調整後EBITDAはすべて同社の予測範囲を上回りました。これらの好調な結果にもかかわらず、2025会計年度の収益予測は変わらないので、加入者ベースにおける課題は続いており、成長への道筋は不透明です。
Pelotonの第1四半期の業績は予想を上回り、EBITDAは予想を上回りました。同社の25年度の最新のガイダンスによると、EBITDAは2億4000万ドルから2億9000万ドルに達する可能性があり、これは現在のストリートコンセンサスである2億3200万ドルを上回っています。Pelotonは今年EBITDAが3億ドルを超える可能性があり、今後数年間で4億ドル以上を達成する可能性があると考えられています。
ペロトンが成長よりも収益性を重視していることが焦点となっており、最新の四半期決算はこの戦略的ピボットを裏付けています。この収益性中心のアプローチへの継続的な取り組みは、EBITDAの改善に大きな可能性を秘めていると認識されていますが、企業が成長優先に戻った場合に起こりうるリスクについては懸念が残ります。
注
TipRanksは、金融アナリストの分析データと、アナリストの的中率および平均リターンに関する情報を提供している独立第三者です。提供された情報はあくまで参考情報であり、いかなる投資のアドバイスも行うものではありません。本コンテンツでは、レーティング情報などの完全性と正確性を保証しません。
TipRanksは、アナリストの的中率と平均リターンを総合的に算出して評価したスターレーティングを提供しています。1つ星から5つ星のスターレーティングでパフォーマンスを表示しています。星の数が多いほど、そのアナリストのパフォーマンスもより優れています。
アナリストの的中率は、最近1年間におけるアナリストのレーティング的中数がレーティング総数に占める割合を指します。レーティングが的中したかどうかは、TipRanksのバーチャルポートフォリオがその銘柄からプラスのリターンを獲得しているかどうかに基づいています。
平均リターンとは、アナリストの初回レーティングに基づいて作成したバーチャルポートフォリオに対して、レーティングの変化に基づいてポートフォリオを調整することによって獲得した最近一年間のリターン率を指します。
 また、$ペロトン・インタラクティブ (PTON.US)$の最近の主なアナリストの観点は以下の通りである:

 Furthermore, according to the comprehensive report, the opinions of