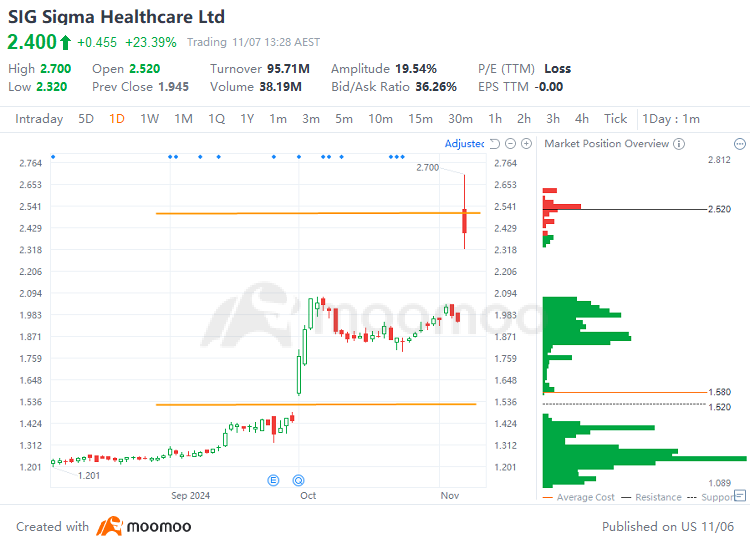
$Sigma Healthcare Ltd (SIG.AU)$ shares rose 23.39% on Thursday, with trading volume expanding to A$95.71 million. The stock price has reached a new record high. Sigma has risen 24.68% over the past week, with a cumulative gain of 139.57% year-to-date.
Sigma's technical analysis chart:
Technical Analysis:
Support: A$1.52
 Resistance: A$2.52
Price range A$1.52 to A$2.52: The trading range indicates a heavy concentration of buy orders, with the stock price on an upward trend. The stock repeatedly touched the level near A$1.52, where it found significant support and broke upward. There is a strong presence of buy orders around A$1.52, suggesting a robust foundation for the price. There is considerable upward pressure near the resistance level of A$2.52, with a lot of profit-taking positions, which suggests strong selling pressure. Going forward, it will be crucial to monitor whether the stock can effectively break through the resistance level at A$2.52.
Market News :
The ACCC decided not to oppose the merger of Sigma Healthcare Limited and CW Group Holdings Limited, following Sigma's acceptance of a court-enforceable undertaking. On December 11, 2023, the two companies entered into an agreement for Sigma to acquire all Chemist Warehouse shares in a deal valued at A$700 million, comprising Sigma shares and cash. Upon completion, Chemist Warehouse shareholders will own 85.75% of the combined ASX-listed entity, with Sigma shareholders holding the remaining 14.25%. This transaction effectively represents a reverse acquisition of Sigma by Chemist Warehouse.
Overall Analysis:
Fundamentally, focus on the company's performance and operational status. Technically, it is necessary to monitor whether the support at the support level remains valid, and whether the resistance level can be effectively broken through.
In this scenario, investors should adopt a cautious strategy, setting stop-loss points to manage risk and maintaining ongoing vigilance regarding company developments and market conditions.
$Sigma Healthcare Ltd (SIG.AU)$ 木曜日に株価は23.39%上昇し、取引高はA$9571万に拡大しました。株価は新記録高を記録しました。過去1週間でSigmaは24.68%上昇し、年初来の累計利益率は139.57%増加しました。
Sigmaのテクニカル分析チャート:
テクニカル分析:
ニュース:
ACCCは、Sigma Healthcare LimitedとCW Group Holdings Limitedの合併に異議を唱えない決定を下した。これは、Sigmaが裁判所による強制執行可能な約束を受け入れたことに続くものである。2023年12月11日、両社は合意し、A$70000万での取引(Sigma株および現金で支払い)により、Chemist Warehouseの全株式をSigmaが取得することとなった。取引完了後、Chemist Warehouseの株主は、ASXに上場された統合企業の85.75%を所有し、Sigmaの株主は残りの14.25%を保有することになる。この取引は事実上、Chemist WarehouseによるSigmaの逆買収を表すものである。
総合分析:
基本的には、会社の業績と運用状況に焦点を当てるべきです。テクニカル分析的には、サポートレベルでのサポートが有効であるか、また抵抗レベルを効果的に突破できるかどうかを監視する必要があります。
このシナリオでは、投資家は慎重な戦略を採用するべきであり、リスクを管理するためにストップロスポイントを設定し、企業の動向や市場状況について継続的な警戒を保つべきです。

 サポート:A$2.52

 Resistance: A$2.52