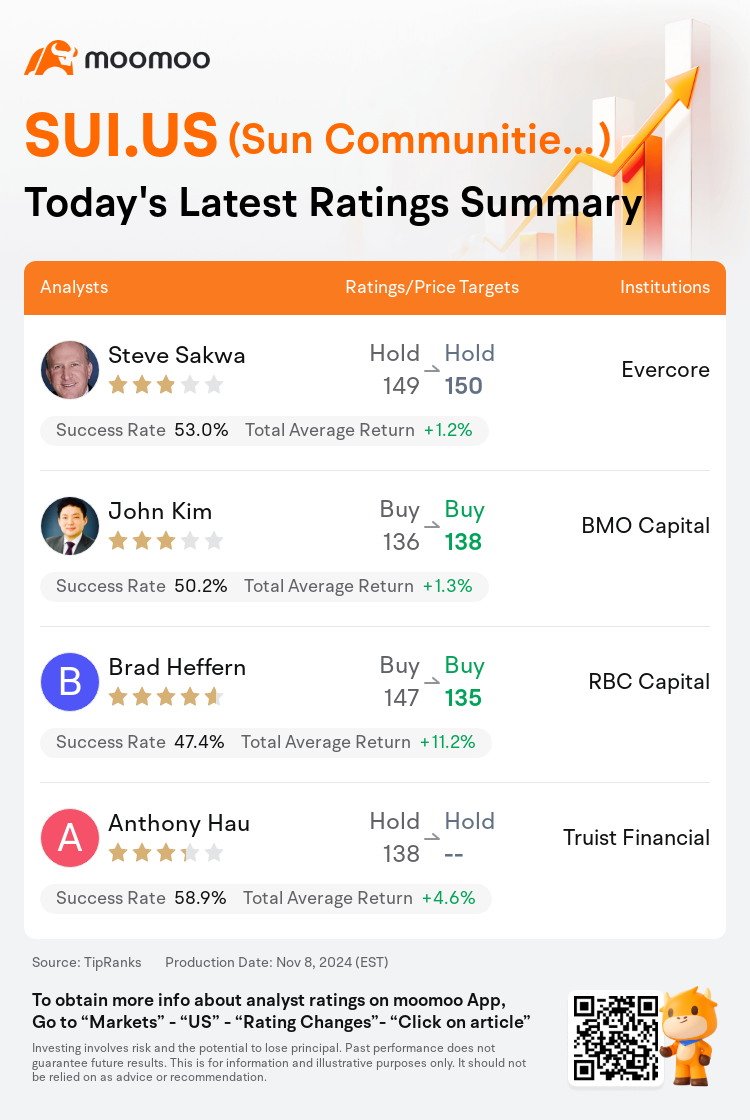
On Nov 08, major Wall Street analysts update their ratings for $Sun Communities Inc (SUI.US)$, with price targets ranging from $135 to $150.
Evercore analyst Steve Sakwa maintains with a hold rating, and adjusts the target price from $149 to $150.
BMO Capital analyst John Kim maintains with a buy rating, and adjusts the target price from $136 to $138.
 RBC Capital analyst Brad Heffern maintains with a buy rating, and adjusts the target price from $147 to $135.
Truist Financial analyst Anthony Hau maintains with a hold rating.
Furthermore, according to the comprehensive report, the opinions of $Sun Communities Inc (SUI.US)$'s main analysts recently are as follows:
Sun Communities experienced one of the most challenging quarters in recent memory, with a combination of increased expenses, subdued demand in the transient/marina segment, hurricane repercussions, and a slower response in adjusting expenses negatively impacting the company's outlook. As a result, there has been a 5% decrease in the guidance for 2024.
Sun Communities' third-quarter results were notably disappointing, marked by a core FFO per share miss and lowered guidance. Concurrently, the company announced substantial management changes, including the retirements of the CEO and a board member. It is anticipated that these adjustments may precede more considerable strategic shifts, potentially involving the divestiture or sale of Park Holidays or Safe Harbor.
The relative resiliency of the business model for Sun Communities is acknowledged, yet the company's quarterly reports have shown a lack of resilience. With an adjustment in guidance for North America same-store Net Operating Income (NOI) growth by 2.25% across every segment, there is a cautious approach until the company can demonstrate consistent, stable quarters.
Here are the latest investment ratings and price targets for $Sun Communities Inc (SUI.US)$ from 4 analysts:

Note:
TipRanks, an independent third party, provides analysis data from financial analysts and calculates the Average Returns and Success Rates of the analysts' recommendations. The information presented is not an investment recommendation and is intended for informational purposes only.
Success rate is the number of the analyst's successful ratings, divided by his/her total number of ratings over the past year. A successful rating is one based on if TipRanks' virtual portfolio earned a positive return from the stock. Total average return is the average rate of return that the TipRanks' virtual portfolio has earned over the past year. These portfolios are established based on the analyst's preliminary rating and are adjusted according to the changes in the rating.
TipRanks provides a ranking of each analyst up to 5 stars, which is representative of all recommendations from the analyst. An analyst's past performance is evaluated on a scale of 1 to 5 stars, with more stars indicating better performance. The star level is determined by his/her total success rate and average return.
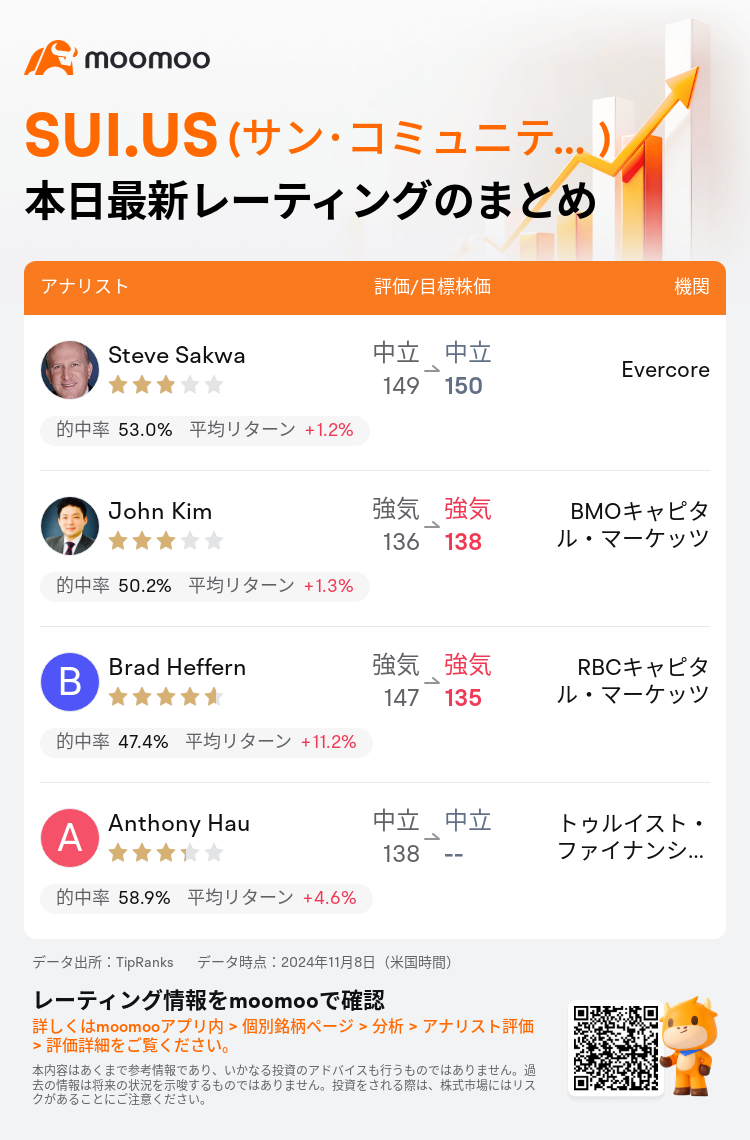
11月8日(米国時間)、ウォール街主要機関のアナリストが$サン・コミュニティーズ (SUI.US)$のレーティングを更新し、目標株価は135ドルから150ドル。
EvercoreのアナリストSteve Sakwaはレーティングを中立に据え置き、目標株価を149ドルから150ドルに引き上げた。
BMOキャピタル・マーケッツのアナリストJohn Kimはレーティングを強気に据え置き、目標株価を136ドルから138ドルに引き上げた。
 RBCキャピタル・マーケッツのアナリストBrad Heffernはレーティングを強気に据え置き、目標株価を147ドルから135ドルに引き下げた。
トゥルイスト・ファイナンシャルのアナリストAnthony Hauはレーティングを中立に据え置き。
また、$サン・コミュニティーズ (SUI.US)$の最近の主なアナリストの観点は以下の通りである:
サン・コミュニティーズは最近の記憶に残る中でも最も厳しい四半期を経験しました。増加した経費、移動別/マリーナセグメントでの需要の低迷、ハリケーンの影響、経費の調整への遅れが会社の見通しに悪影響を与えました。その結果、2024年のガイダンスが5%減少しました。
サン・コミュニティーズは、第三四半期の結果が顕著に失望を招き、フットボールフィールド当たりの基本的なFFOが予想を下回り、ガイダンスが下方修正されました。同時に、CEOと取締役の退任など、重要な経営陣の変更が発表されました。これらの調整が、より大規模な戦略的変化を前もって示唆し、Park HolidaysまたはSafe Harborの売却または放出を含む可能性があります。
サン・コミュニティーズの事業モデルの相対的な回復力は認められていますが、会社の四半期報告では回復力の欠如が示されています。北米ストア同店舗の純営業収益(NOI)成長のガイダンスが全セグメントで2.25%調整されたため、会社が一貫した安定した四半期を示すまで注意深いアプローチが取られます。
以下の表は今日4名アナリストの$サン・コミュニティーズ (SUI.US)$に対する最新レーティングと目標価格である。

注
TipRanksは、金融アナリストの分析データと、アナリストの的中率および平均リターンに関する情報を提供している独立第三者です。提供された情報はあくまで参考情報であり、いかなる投資のアドバイスも行うものではありません。本コンテンツでは、レーティング情報などの完全性と正確性を保証しません。
TipRanksは、アナリストの的中率と平均リターンを総合的に算出して評価したスターレーティングを提供しています。1つ星から5つ星のスターレーティングでパフォーマンスを表示しています。星の数が多いほど、そのアナリストのパフォーマンスもより優れています。
アナリストの的中率は、最近1年間におけるアナリストのレーティング的中数がレーティング総数に占める割合を指します。レーティングが的中したかどうかは、TipRanksのバーチャルポートフォリオがその銘柄からプラスのリターンを獲得しているかどうかに基づいています。
平均リターンとは、アナリストの初回レーティングに基づいて作成したバーチャルポートフォリオに対して、レーティングの変化に基づいてポートフォリオを調整することによって獲得した最近一年間のリターン率を指します。
 RBCキャピタル・マーケッツのアナリストBrad Heffernはレーティングを強気に据え置き、目標株価を147ドルから135ドルに引き下げた。

 RBC Capital analyst Brad Heffern maintains with a buy rating, and adjusts the target price from $147 to $135.