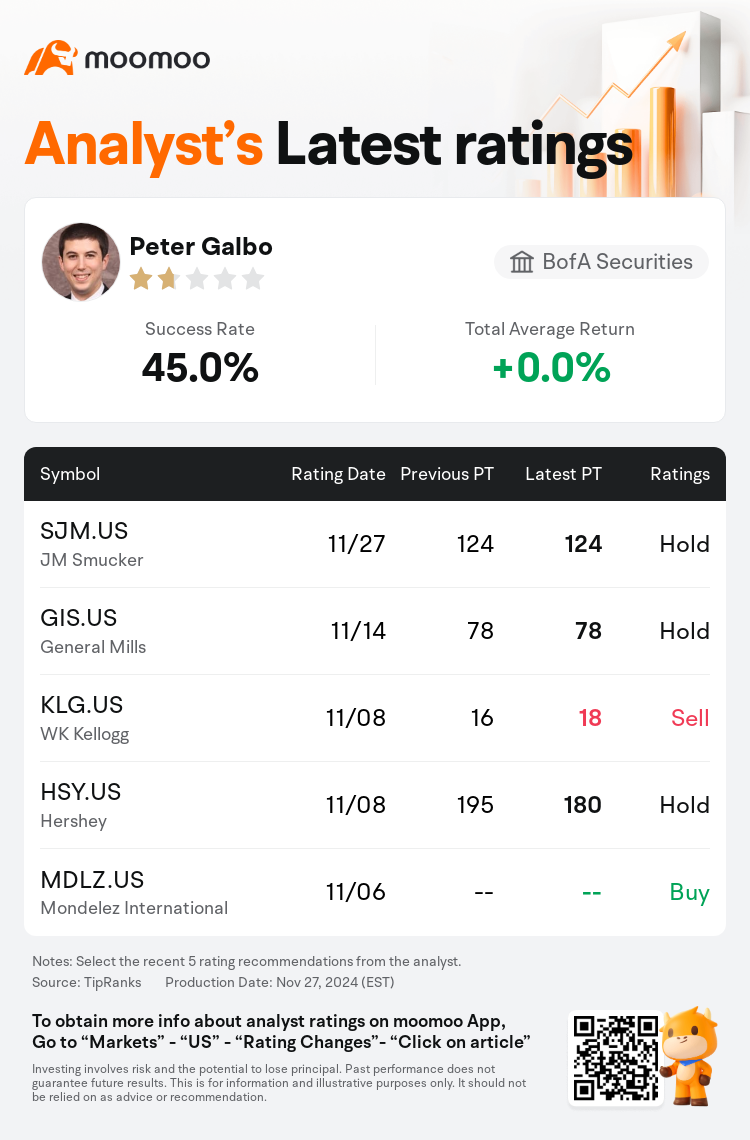
BofA Securities analyst Peter Galbo maintains $JM Smucker (SJM.US)$ with a hold rating, and maintains the target price at $124.
According to TipRanks data, the analyst has a success rate of 45.0% and a total average return of 0.0% over the past year.

 Furthermore, according to the comprehensive report, the opinions of $JM Smucker (SJM.US)$'s main analysts recently are as follows:
The firm adjusted its forecast for FY25 adjusted EPS to $9.90 following the Q2 results surpassing expectations. It is noted that the stock's valuation multiple is currently discounted compared to the average of the packaged food peer group, yet aligns with counterparts in the center store segment. This alignment is considered appropriate as Smucker moves forward with its FY25 objectives, albeit with some execution risks associated with Hostess.
Amid concerns about potential earnings per share adjustments due to weak inflation figures in Hostess and Coffee segments, the relief came from the company's second quarter sales and profit outperformance alongside an uplift in its full-year earnings projection. It appears that despite remaining challenges, there has been noteworthy progress.
The company delivered a strong performance in its second quarter, with organic volumes impressive against the food sector backdrop. Margin improvements in Coffee, fueled by pricing strategies, were noted, though as coffee costs increase, expectations are for elasticity to rise, potentially pressuring margins. Moreover, a robust margin in the Pet segment leads to questions about the extent of embedded stranded overheads.
Note:
TipRanks, an independent third party, provides analysis data from financial analysts and calculates the Average Returns and Success Rates of the analysts' recommendations. The information presented is not an investment recommendation and is intended for informational purposes only.
Success rate is the number of the analyst's successful ratings, divided by his/her total number of ratings over the past year. A successful rating is one based on if TipRanks' virtual portfolio earned a positive return from the stock. Total average return is the average rate of return that the TipRanks' virtual portfolio has earned over the past year. These portfolios are established based on the analyst's preliminary rating and are adjusted according to the changes in the rating.
TipRanks provides a ranking of each analyst up to 5 stars, which is representative of all recommendations from the analyst. An analyst's past performance is evaluated on a scale of 1 to 5 stars, with more stars indicating better performance. The star level is determined by his/her total success rate and average return.
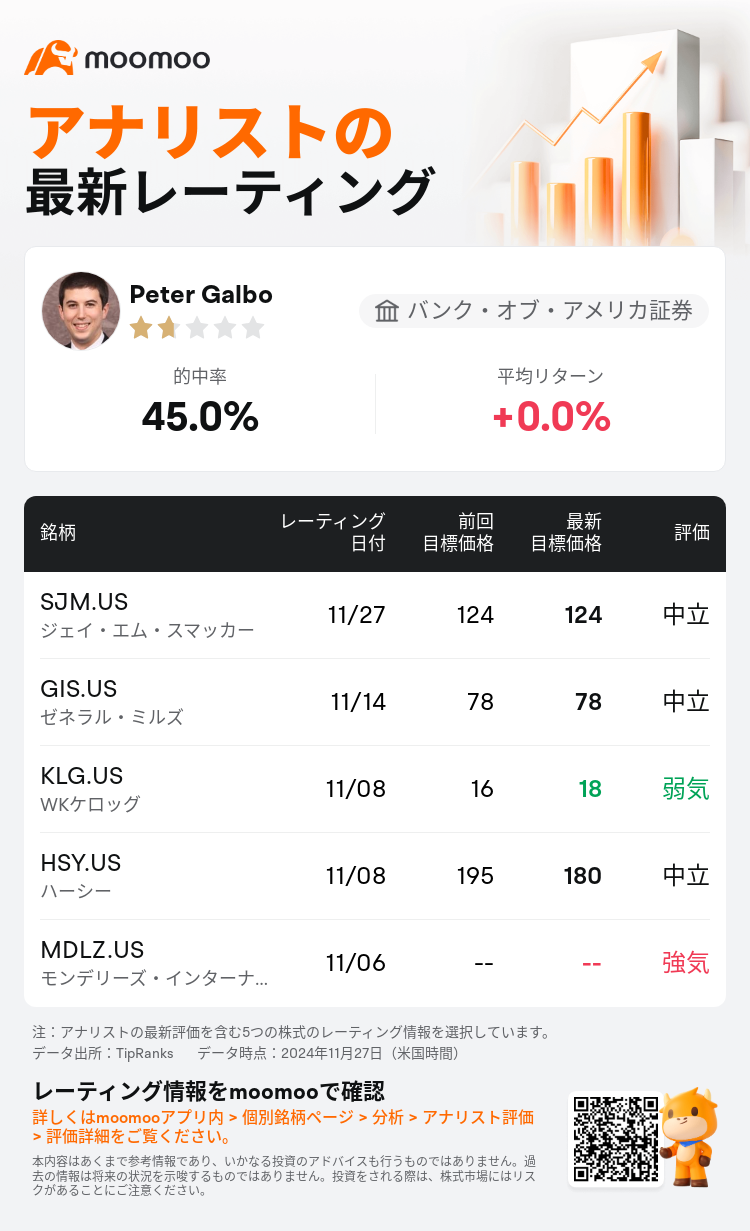
バンク・オブ・アメリカ証券のアナリストPeter Galboは$ジェイ・エム・スマッカー (SJM.US)$のレーティングを中立に据え置き、目標株価を124ドルに据え置いた。
TipRanksのデータによると、このアナリストの最近1年間の的中率は45.0%、平均リターンは0.0%である。

 また、$ジェイ・エム・スマッカー (SJM.US)$の最近の主なアナリストの観点は以下の通りである:
企業は、第2四半期の業績が期待を上回ったことを受けて、2025会計年度の調整後eps予測を9.90ドルに調整しました。包装食品の同業他社の平均に比べて株式の評価倍率が割引されている現状にもかかわらず、センターストアセグメントの競合他社と調整が合致していることが指摘されています。この調整は、スマッカー社がFY25の目標を前進させる中で適切と考えられており、ホステスと関連する一部の実行リスクが存在します。
ホステスとコーヒーセグメントの低インフレ率に起因する利益配当調整への懸念の中、企業の第2四半期の売上および利益の好調な業績と年間予測の上昇によって安心感がもたらされました。残る課題があるにもかかわらず、注目すべき進歩が見られるようです。
企業は、第2四半期に食品セクターの背景に対して印象的な有機成長を遂げました。コーヒーの利益改善は価格戦略によって後押しされましたが、コーヒー原価が上昇すると、弾力性が高まり、マージンに圧力がかかるとの見通しです。さらに、ペットセグメントの堅実なマージンには、埋没した固定経費の程度についての疑問が投げかけられています。
注
TipRanksは、金融アナリストの分析データと、アナリストの的中率および平均リターンに関する情報を提供している独立第三者です。提供された情報はあくまで参考情報であり、いかなる投資のアドバイスも行うものではありません。本コンテンツでは、レーティング情報などの完全性と正確性を保証しません。
TipRanksは、アナリストの的中率と平均リターンを総合的に算出して評価したスターレーティングを提供しています。1つ星から5つ星のスターレーティングでパフォーマンスを表示しています。星の数が多いほど、そのアナリストのパフォーマンスもより優れています。
アナリストの的中率は、最近1年間におけるアナリストのレーティング的中数がレーティング総数に占める割合を指します。レーティングが的中したかどうかは、TipRanksのバーチャルポートフォリオがその銘柄からプラスのリターンを獲得しているかどうかに基づいています。
平均リターンとは、アナリストの初回レーティングに基づいて作成したバーチャルポートフォリオに対して、レーティングの変化に基づいてポートフォリオを調整することによって獲得した最近一年間のリターン率を指します。
 また、$ジェイ・エム・スマッカー (SJM.US)$の最近の主なアナリストの観点は以下の通りである:

 Furthermore, according to the comprehensive report, the opinions of