
US Stock Trading Basics
The appeal of the US stock market seen from a chart
A long-term rise in the US stock market that is unparalleled in the world
The NY Dow Average, which moved across the 1000 dollar mark for about 10 years from 1972, entered a full-scale upward cycle after 1982. The NY Dow Jones Industrial Average, which surpassed the 2000 dollar mark in 1987, reached the 3000 dollar mark in 1991. Four years later, the NY Dow Average, which reached the 4,000 dollar mark in 1995/2, broke through the 5,000 dollar mark in November of the same year. The NY Dow Average, which hit the 6,000 dollar mark in 1996/10 only one year later, reached the 8,000 dollar mark in 1997/7. In 1999/4, the NY Dow Jones Industrial Average reached a major milestone of 10,000 dollars.
After that, the NY Dow Average, which took about 18 years to reach the 20,000 dollar (2017/2) mark, surpassed the first 30,000 dollar mark in 2020/12, and hit an all-time high of 36,952 dollars in 2022/1. Based on the fact that it took about 18 years for the NY Dow Average to rise from the 10,000 dollar range to the 20,000 dollar range, it was unimaginable to investors around the world that the NY Dow Average exceeded 36,000 dollars in just about 3 and a half years thereafter.

Comparing Japan-US stock market performance
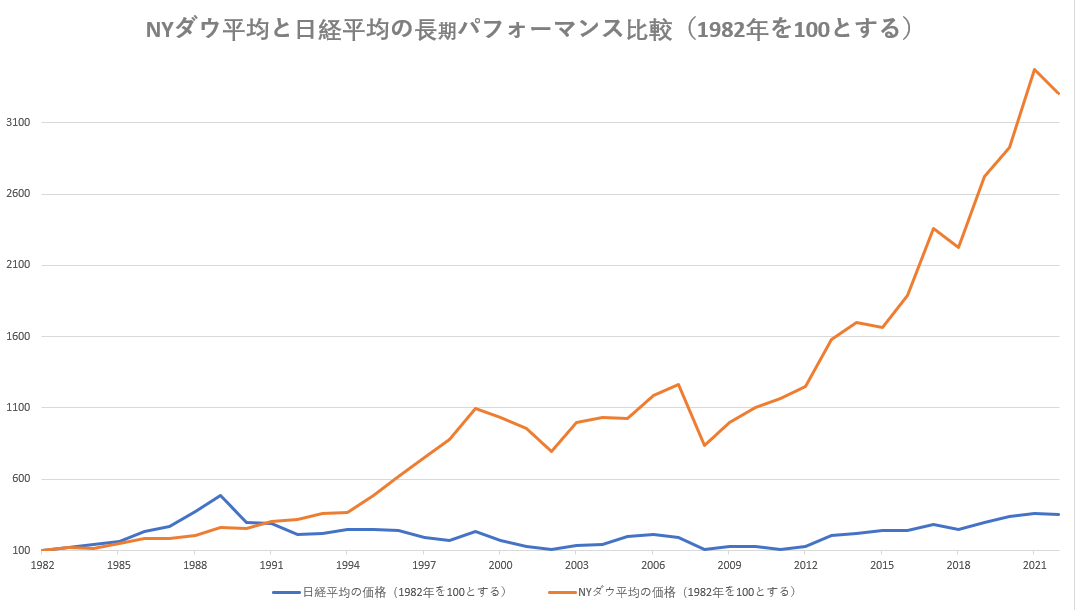
Since the bubble burst in the early 90s, the Japanese stock market has been forced into a long-term slump. In 2012/11, the Liberal Democratic Party's return to power due to the dissolution of the House of Representatives and policy developments such as overcoming deflation and a different dimensional monetary policy were triggered, and the Nikkei Stock Average began to rise. The upward trend in the Nikkei Stock Average over 8 years is known as the “Abenomics Market,” and the “three arrows” launched by the Abe administration supported the long-standing upward market.
On the other hand, when comparing 1982 and later, when the long-term rise of the NY Dow Average began with the Nikkei Stock Average, the strength of the NY Dow Average was remarkable. The NY Dow Average, which overcame repeated stock market plunge phases such as Black Monday (1987/10), LTCM bankruptcy (1998/9), the collapse of the dot com bubble (mid-2000), the China shock (2015/6), and the coronavirus shock (2020/2), updated high prices each time. Comparing the performance of the Japanese and US stock markets for 40 years after 1982, the Nikkei Stock Average rose 3.4 times, while the NY Dow Average rose 32 times during the same period.
Comparing nominal GDP and market capitalization of Japan and the US
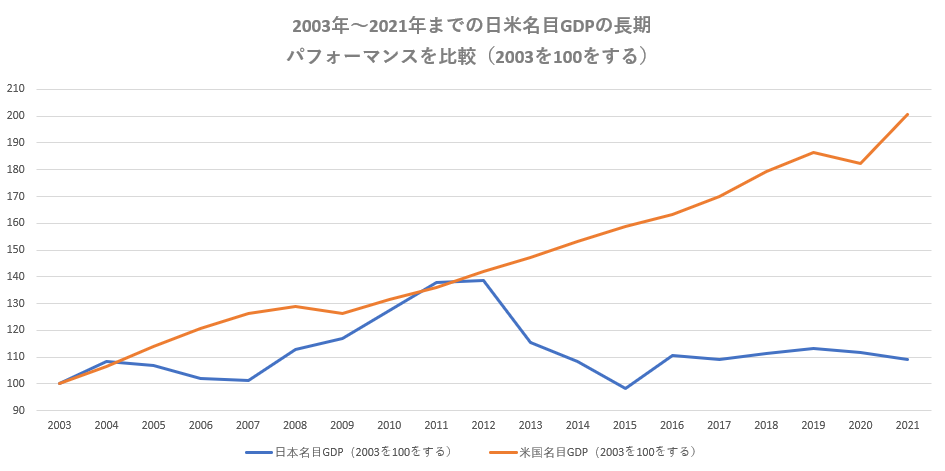
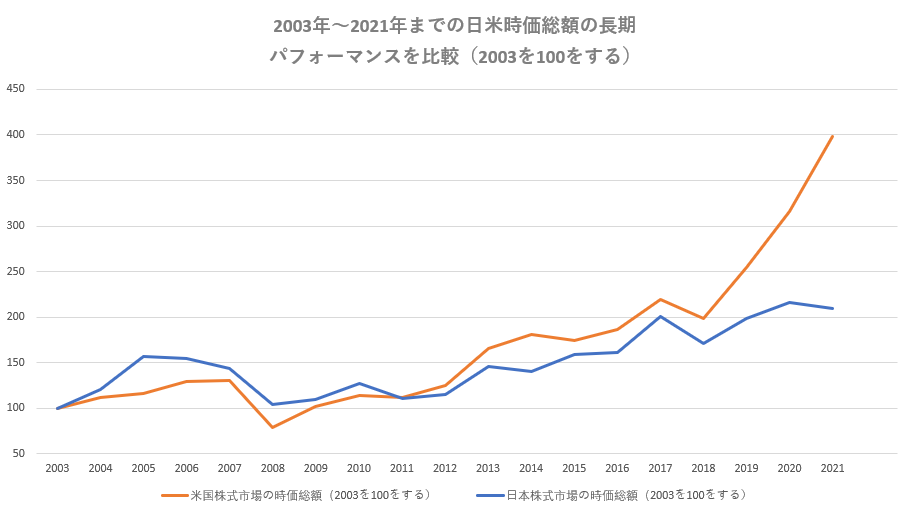
The Buffett index is an index that determines how high or undervalued stock prices are, and it is the value obtained by dividing the total market value of the stock market by nominal GDP (gross domestic product). The total market value of a country's stock market is known as an indicator that Warren Buffett, a famous American investor, places importance on because of the idea that the total market value of that country's stock market will approach a level commensurate with the expansion of that country's economic scale over the long term.
While America's nominal GDP expanded by about 2 times from 11.145.6 billion dollars in 2003 to 22.996 billion dollars in 2021, the total market value of the US stock market also expanded about 3.98 times from 13.5 trillion dollars to 53.8 trillion dollars (2022/9) during the same period. In contrast, Japan's nominal GDP expanded approximately 1.09 times from 4,519.6 billion dollars in 2003 to 4,9374 billion dollars in 2021, and the total market value of the Japanese stock market expanded 2.1 times from 3,158.2 billion dollars to 6,619.7 billion dollars. You can read the composition where the expansion of the scale of the American economy over a long period of time supports the increase in market capitalization of the US stock market.
AI (artificial intelligence), technological innovation, and digital revolution are the biggest driving forces of the US stock market
While the scale of the American economy is constantly expanding, population increases associated with immigration inflows, large-scale fiscal measures by the US government, and clever monetary policies by the Fed are listed as driving forces for the long-term rise in the US stock market, the existence of American IT Gulliver represented by GAFAM cannot be overlooked.
GAFAM is a neologism taken from the initials of the five companies Google (Google), Amazon (Amazon), and the meta-subsidiaries Facebook (Facebook), Apple (Apple), and Microsoft (Microsoft), which are under the umbrella of Alphabet, and is also used by Japanese people as representative companies of the United States in various business categories such as information technology, retail/logistics, social networking services (SNS), hardware, software, etc. I'm very familiar with it.
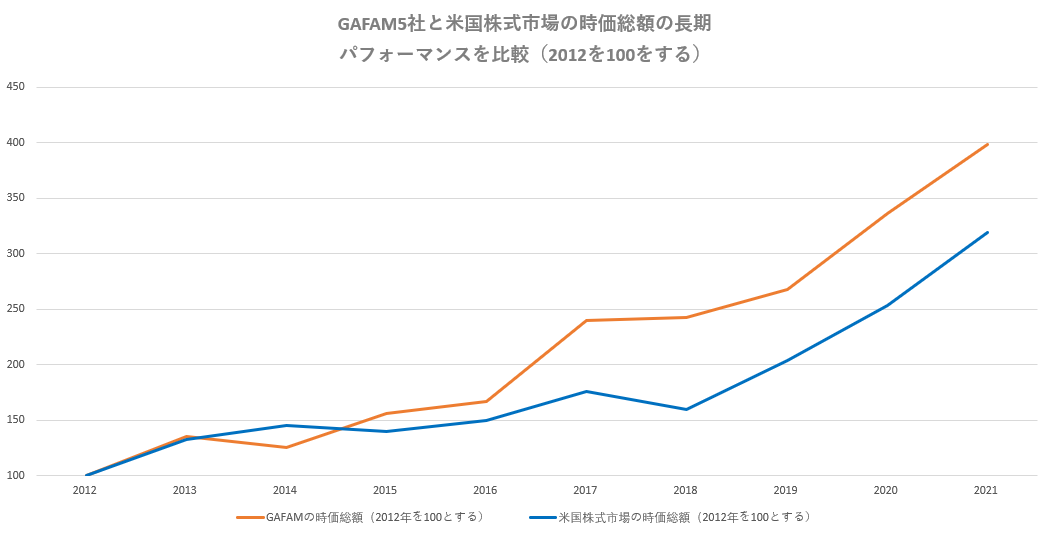
GAFAM leads the US stock market
We will confirm once again the overwhelming presence of GAFAM from the stock prices and stock market capitalization of the five companies. It's obvious at a glance if you compare the performance of the five GAFAM5 companies from 2012 to 2021 with the NY Dow Average, which is the benchmark for the US stock market. In contrast to the increase of about 2.8 times the NY Dow average, Amazon showed performance well above the NY Dow average, with Amazon about 13.3 times, Apple about 9.3 times, Meta about 12.7 times, Alphabet about 8.2 times, and Microsoft about 12.5 times.
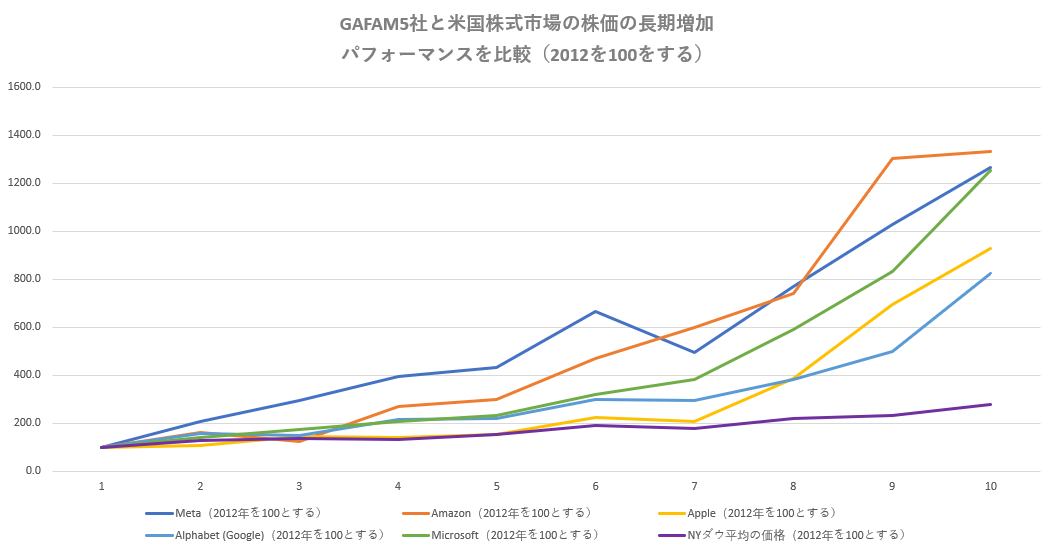
The breakthrough in the total market value of GAFAM5 shares is also remarkable. The total stock market value of GAFAM was approximately 1,388.1 billion dollars as of 2012, but it expanded more than 2.8 times to 3,881.9 billion dollars in 2021. In 2020/5, the total market value of the 5 GAFAM5 companies exceeded the total market capitalization of 2200 companies on the 1st section of the Tokyo Stock Exchange, and it is also fresh in my memory that this topic buzzed with Japanese economic newspapers. GAFAM's stock market capitalization expansion contributed greatly to the background of the three-fold increase in market capitalization of the US stock market from 2012 to 2021.
The US stock market driven by Micro
The formation of corporate stock prices and stock market growth are influenced by macro factors such as the country's economic scale, economic trends such as prices, etc., policy interest rates, fiscal transfers by country, etc., and by microfactors such as expansion of corporate performance associated with technological innovation and the birth of new business type companies. While it is said that the Japanese stock market and mainland China market are easily affected by macro trends, in the case of the United States, leading companies such as GAFAM continue to grow over a long period of time, and there is a large micro presence where the birth of new business type companies associated with technological innovation contributes to the US stock market.
The fourth industrial revolution, which is sometimes talked about in the stock market, is also called industry 4.0, and it is a technological innovation project related to the manufacturing industry where human resource development is rapidly progressing in countries around the world, led by the US and Germany, and it is expected that drastic changes will occur in existing industries through technological innovation in various advanced fields such as IoT (Internet of Things), big data, AI (artificial intelligence), robots, etc. In America, which leads the world in science and technology, it seems that cutting-edge companies that have not yet been seen, starting with GAFAM, will play a leading role in the US stock market.
