Technical indicators
Moomoo provides a wealth of technical indicators, supports user-defined indicator parameters, self-editing indicators, and helps investors analyze stock trends. The indicators are divided into main chart indicators and sub chart indicators. The candlestick chart is the main chart, the one below the main chart is the sub chart, and multiple sub charts can be opened.
1. Mobile phone
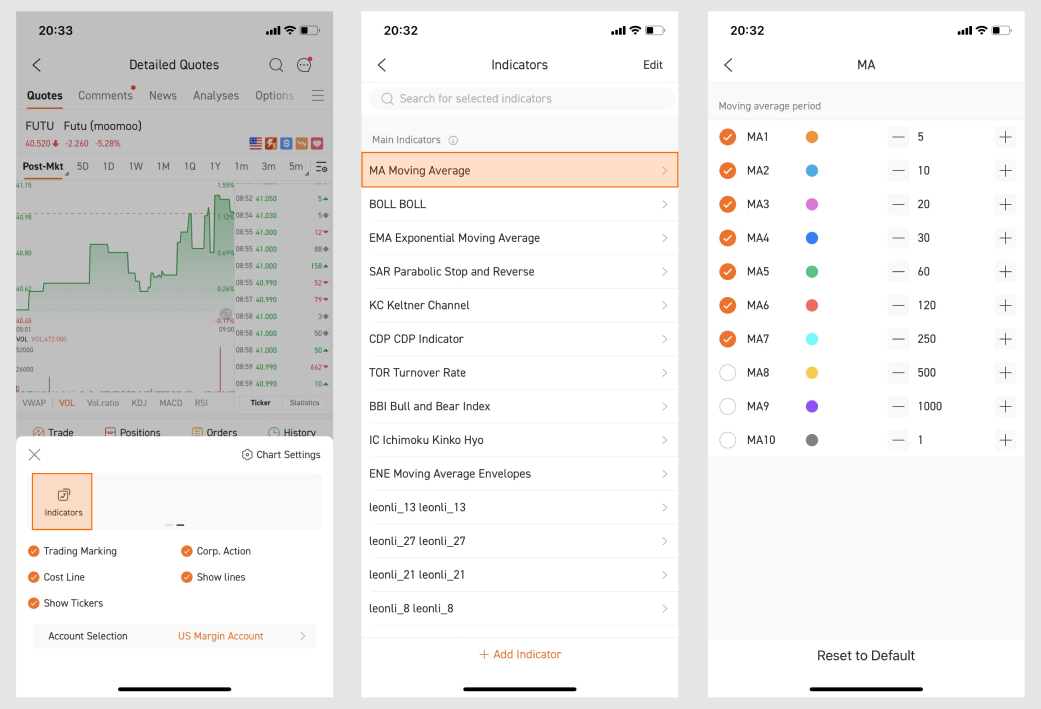
1.1 In portrait mode, click on the sub-chart to switch indicators;
1.2 In landscape mode, drag the column on the right to view and switch frequently used indicators;
1.3 Indicator management: portrait mode: Button in the upper right corner of the chart - indicator management.

2. Desktop
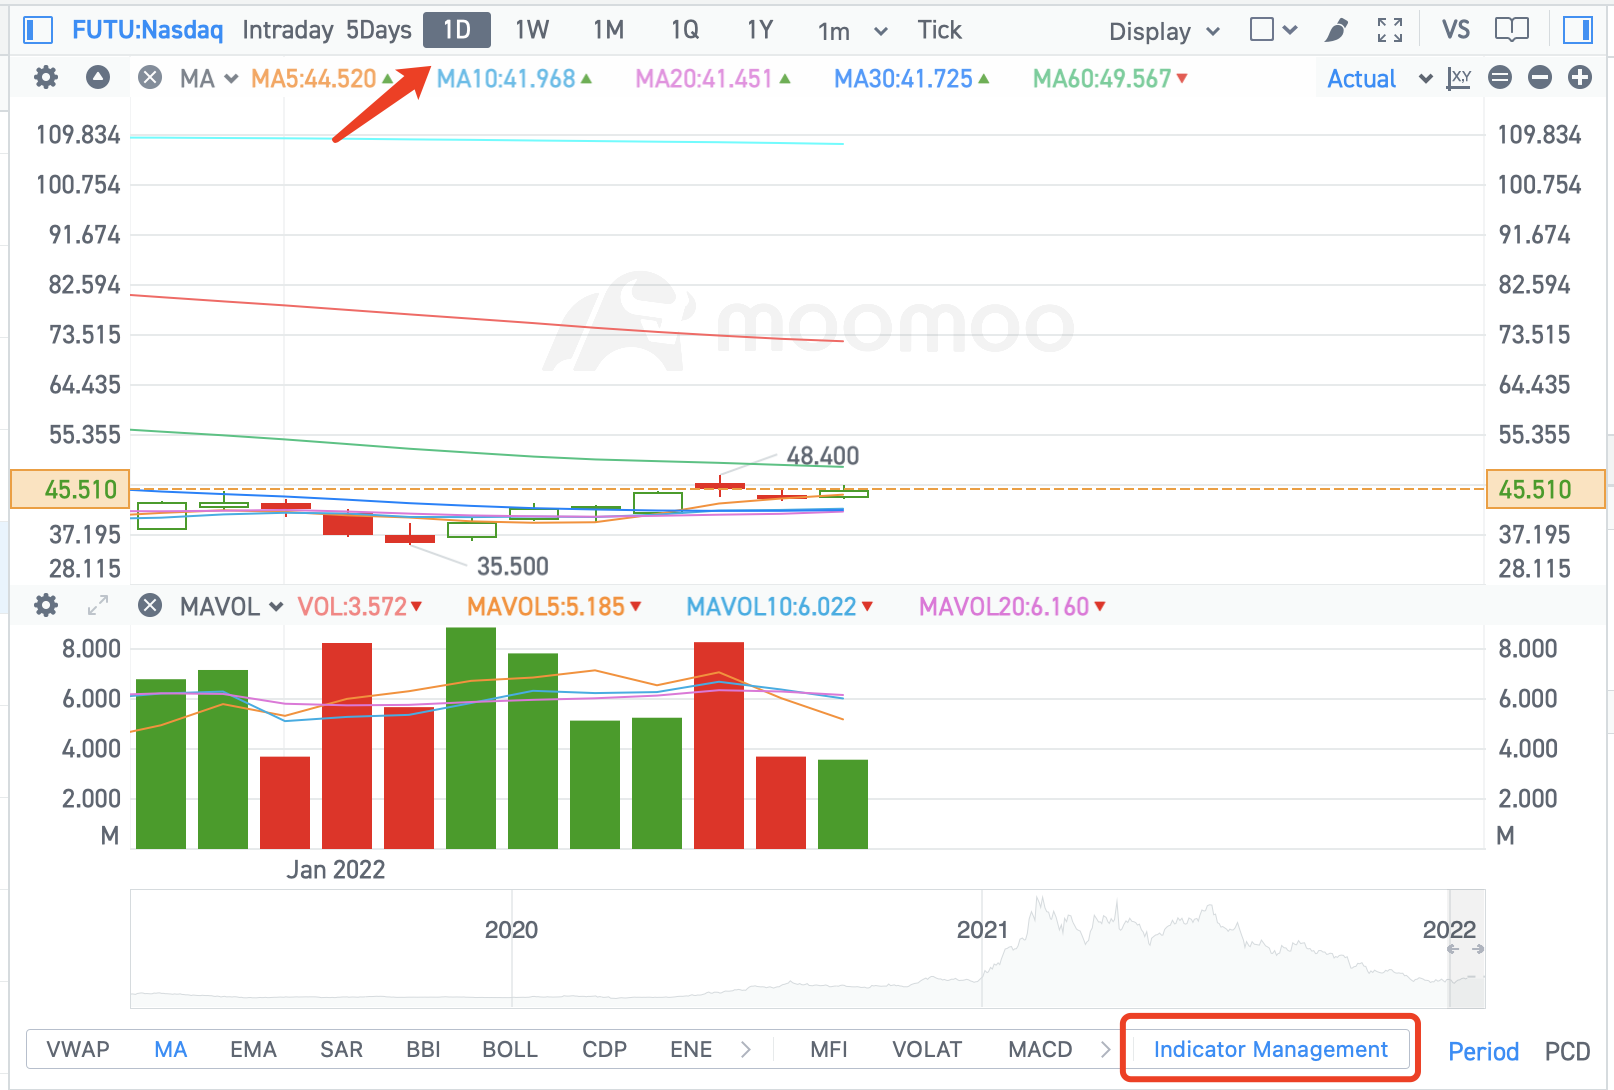
2.1 The indictor's name and current value are displayed on the indicator bar, click the curve name to hide or display.
2.2 Click the setting button of the indicator bar, and the indicator parameter settings will pop up. You can set the indicator parameters, color, thickness, display and hidden, etc.
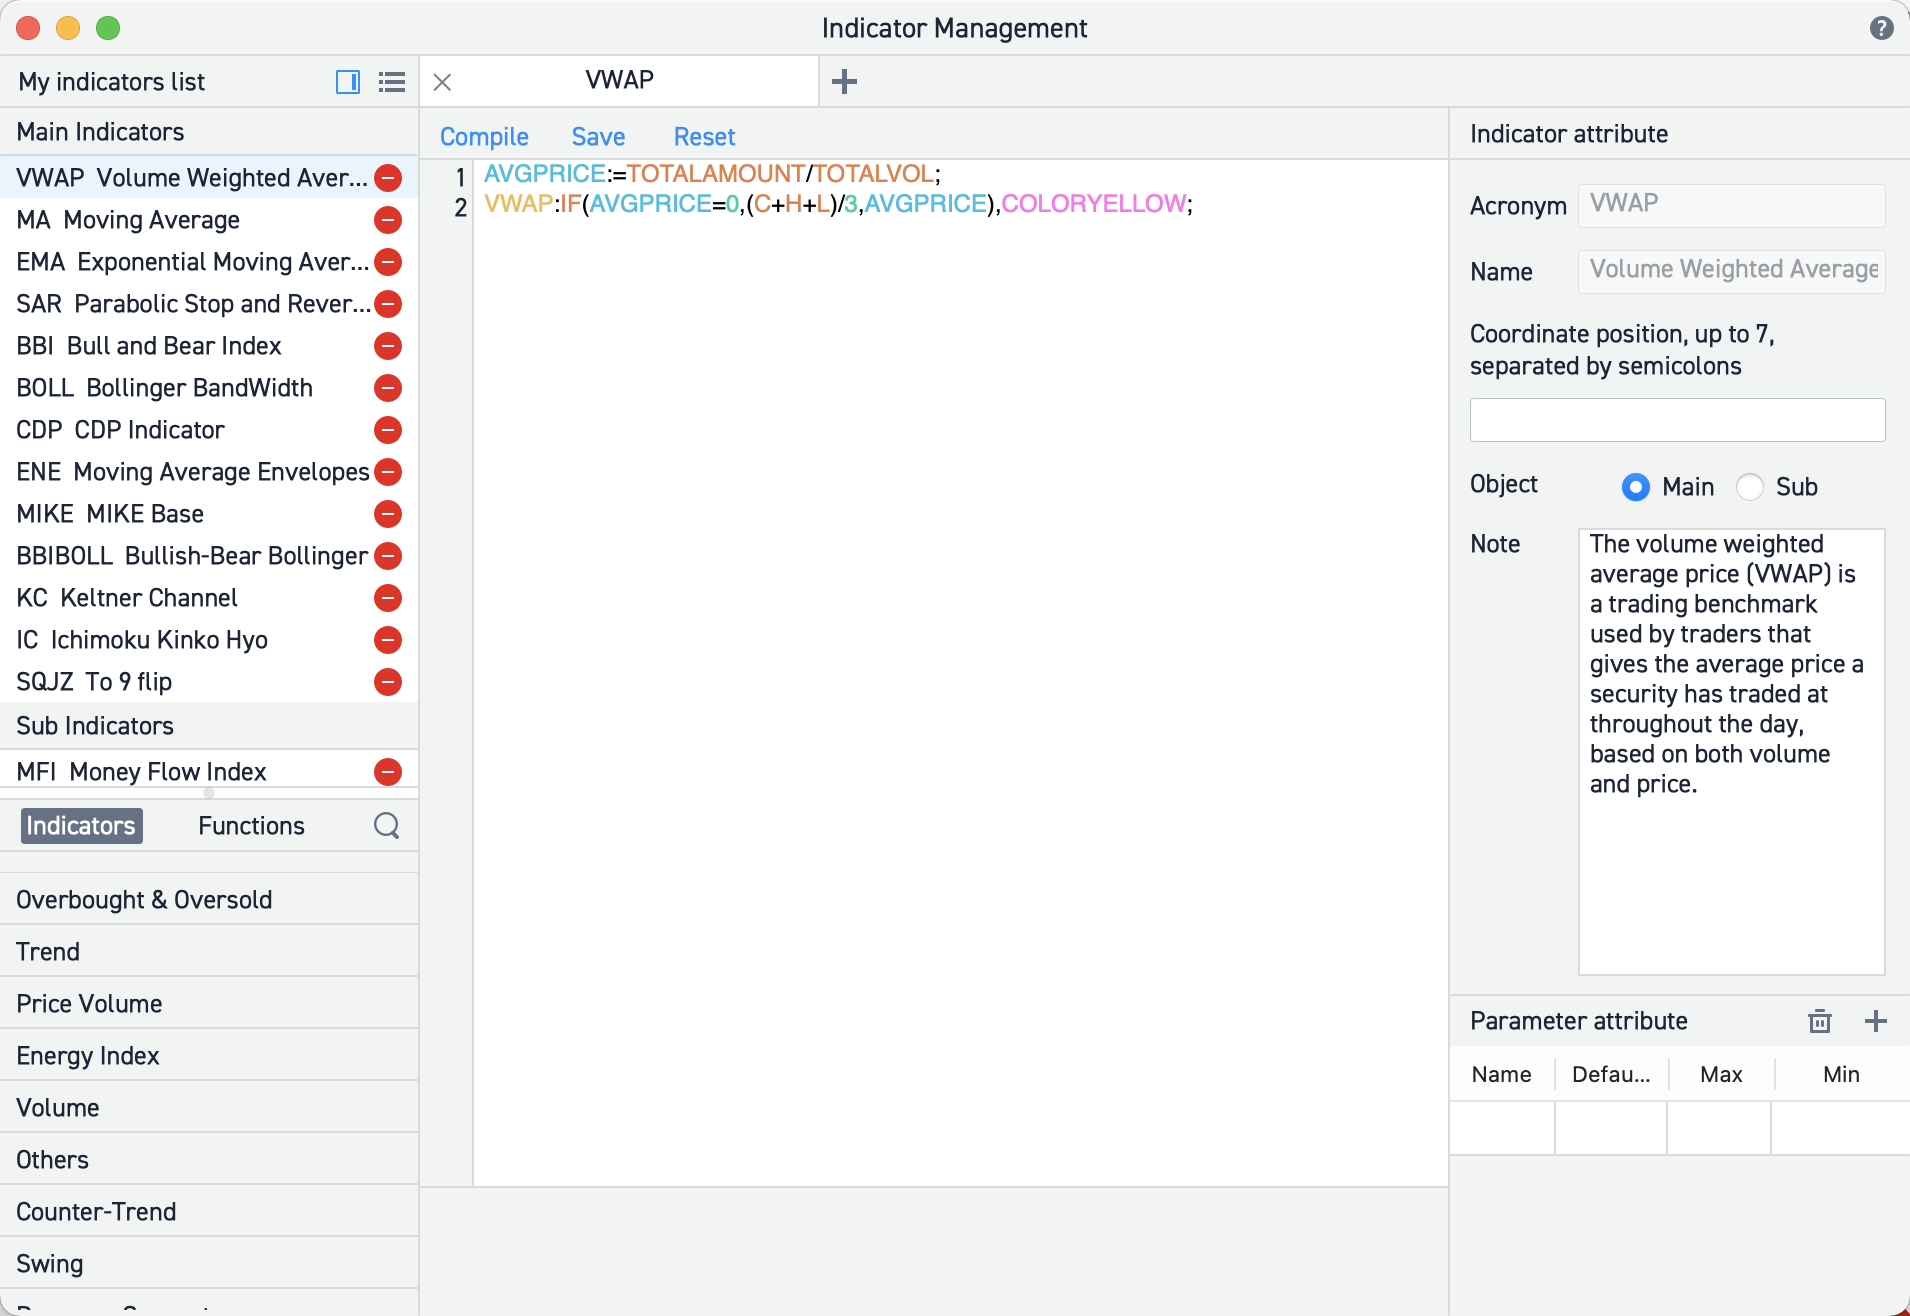
2.3 Quotes chart page - click "Indicator Management" to enter the setting page.


Risk Disclosure This presentation is for informational and educational use only and is not a recommendation or endorsement of any particular investment or investment strategy. Investment information provided in this content is general in nature, strictly for illustrative purposes, and may not be appropriate for all investors. It is provided without respect to individual investors’ financial sophistication, financial situation, investment objectives, investing time horizon, or risk tolerance. You should consider the appropriateness of this information having regard to your relevant personal circumstances before making any investment decisions. Past investment performance does not indicate or guarantee future success. Returns will vary, and all investments carry risks, including loss of principal. Moomoo makes no representation or warranty as to its adequacy, completeness, accuracy or timeliness for any particular purpose of the above content.