Shareholders appeared unconcerned with Tsann Kuen (China) Enterprise Co., Ltd.'s (SZSE:200512) lackluster earnings report last week. We think that the softer headline numbers might be getting counterbalanced by some positive underlying factors.
See our latest analysis for Tsann Kuen (China) Enterprise

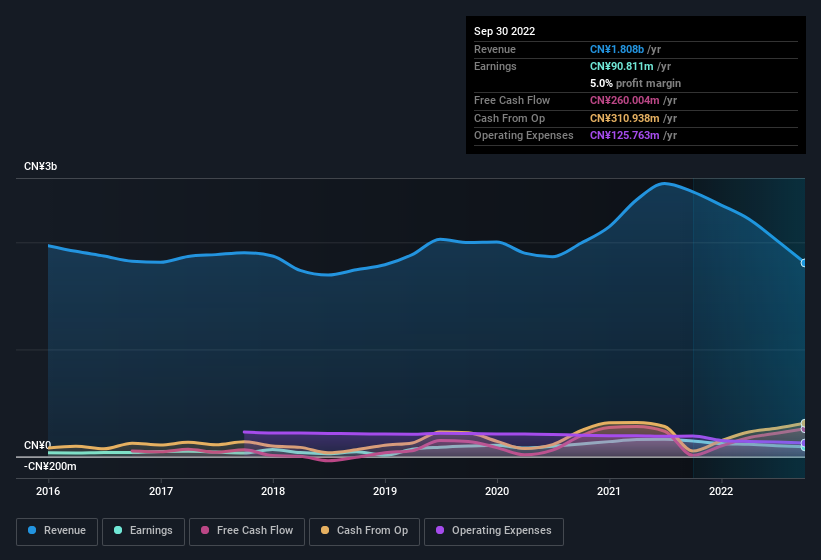
SZSE:200512 Earnings and Revenue History November 4th 2022
Examining Cashflow Against Tsann Kuen (China) Enterprise's Earnings
As finance nerds would already know, the accrual ratio from cashflow is a key measure for assessing how well a company's free cash flow (FCF) matches its profit. The accrual ratio subtracts the FCF from the profit for a given period, and divides the result by the average operating assets of the company over that time. The ratio shows us how much a company's profit exceeds its FCF.
 Therefore, it's actually considered a good thing when a company has a negative accrual ratio, but a bad thing if its accrual ratio is positive. While having an accrual ratio above zero is of little concern, we do think it's worth noting when a company has a relatively high accrual ratio. Notably, there is some academic evidence that suggests that a high accrual ratio is a bad sign for near-term profits, generally speaking.
For the year to September 2022, Tsann Kuen (China) Enterprise had an accrual ratio of -0.60. That implies it has very good cash conversion, and that its earnings in the last year actually significantly understate its free cash flow. In fact, it had free cash flow of CN¥260m in the last year, which was a lot more than its statutory profit of CN¥90.8m. Tsann Kuen (China) Enterprise's free cash flow improved over the last year, which is generally good to see.
Note: we always recommend investors check balance sheet strength. Click here to be taken to our balance sheet analysis of Tsann Kuen (China) Enterprise.
Our Take On Tsann Kuen (China) Enterprise's Profit Performance
Happily for shareholders, Tsann Kuen (China) Enterprise produced plenty of free cash flow to back up its statutory profit numbers. Because of this, we think Tsann Kuen (China) Enterprise's underlying earnings potential is as good as, or possibly even better, than the statutory profit makes it seem! And on top of that, its earnings per share have grown at 5.5% per year over the last three years. Of course, we've only just scratched the surface when it comes to analysing its earnings; one could also consider margins, forecast growth, and return on investment, among other factors. In light of this, if you'd like to do more analysis on the company, it's vital to be informed of the risks involved. While conducting our analysis, we found that Tsann Kuen (China) Enterprise has 2 warning signs and it would be unwise to ignore these.
Today we've zoomed in on a single data point to better understand the nature of Tsann Kuen (China) Enterprise's profit. But there is always more to discover if you are capable of focussing your mind on minutiae. For example, many people consider a high return on equity as an indication of favorable business economics, while others like to 'follow the money' and search out stocks that insiders are buying. So you may wish to see this free collection of companies boasting high return on equity, or this list of stocks that insiders are buying.
Have feedback on this article? Concerned about the content? Get in touch with us directly. Alternatively, email editorial-team (at) simplywallst.com.
This article by Simply Wall St is general in nature. We provide commentary based on historical data and analyst forecasts only using an unbiased methodology and our articles are not intended to be financial advice. It does not constitute a recommendation to buy or sell any stock, and does not take account of your objectives, or your financial situation. We aim to bring you long-term focused analysis driven by fundamental data. Note that our analysis may not factor in the latest price-sensitive company announcements or qualitative material. Simply Wall St has no position in any stocks mentioned.
株主は心配していないようです燦坤実業有限公司(SZSE:200512)先週発表された決算は貴重です。私たちは疲弊した全体的なデータがいくつかの肯定的な潜在的な要素によって相殺されている可能性があると思う
燦坤(中国)企業の最新分析を見てください

SZSE:200512収益と収入の歴史2022年11月4日
キャッシュフローと燦坤(中国)企業収益の比較研究
金融オタクがすでに知っているように現金流動率計ある会社の自由キャッシュフロー(FCF)と利益マッチングの程度を評価する重要な指標である。計算されるべき比率は、所与の期間の利益からFCFを減算し、その後、結果をその期間内の会社の平均運用資産で除算する。この比率は、ある会社の利益が固定キャッシュフローを超えていることを示している
 したがって、ある会社の応算比率が負の場合、それは実際には良いこととされているが、その応計比率が正であれば、それは悪いことである。応算比率がゼロより高いことは懸念されないが,ある会社の課税比率が相対的に高い場合には注意すべきであると考えられる。注目すべきは、一般的に、高応計比率は短期利益にとって良い兆しではないという学術的証拠があることである
燦坤(中国)企業の課税比率は2022年9月期までに-0.60%となった。これはそれが非常に良い現金転換率を持っていることを意味し、それの昨年の収益は実際にその自由キャッシュフローを大幅に過小評価した。事実、同社の昨年の自由キャッシュフローは2億6千万カナダドルで、その法定利益9080万カナダドルをはるかに上回っている。燦坤(中国)企業の昨年の自由キャッシュフローは改善され、全体的に良い
注:私たちはいつも投資家たちが貸借対照表の実力をチェックすることを提案する。ここをクリックして、燦坤(中国)企業の貸借対照表の分析に入ります
われわれの燦坤(中国)企業の利益業績に対する見方
株主を喜ばせたのは、燦坤(中国)企業がその法定利益数を支援するために大量の自由キャッシュフローを生み出したことだ。だからこそ、私たちは燦坤(中国)企業の潜在的な収益の潜在的な利益は法定利益と同じように良く見え、さらにはもっと良いかもしれないと思う!何よりも、その1株当たりの収益は過去3年間で毎年5.5%のペースで増加している。もちろん、その収益を分析する時、私たちは毛皮に触れただけで、人々は利益率、成長予測と投資リターンなどの要素も考慮することができる。そのためには、会社をもっと分析したいなら、そのリスクを知ることが重要です。私たちが分析したところ、燦坤(中国)企業には警告フラグ×2これらを無視するのは賢明ではないだろう
今日、私たちは黄金坤(中国)の企業利益の性質をよりよく知るためにデータ点を拡大した。しかし細かいことに集中する能力があれば、もっと発見しなければならないことがあります。例えば、多くの人は高株収益率が有利な商業経済指標であると考えているが、もう一部の人は“お金についていく”ことを好み、内部の人が購入している株を探している。これを見たいかもしれません無料です高い株収益率を持つ会社の集合、あるいは内部者が購入しているこの株式リスト
この文章に何かフィードバックはありますか。内容が心配ですか。 連絡を取り合う私たちに直接連絡します。あるいは,編集グループに電子メールを送信することも可能であり,アドレスはimplywallst.comである.
本稿ではSimply Wall St.によって作成され,包括的である私たちは歴史データとアナリスト予測に基づくコメントを偏りのない方法で提供するだけで、私たちの文章は財務アドバイスとしてのつもりはありません。それは株を売買する提案にもなりませんし、あなたの目標やあなたの財務状況も考慮していません。私たちの目標はあなたにファンダメンタルデータによって駆動される長期的な重点分析をもたらすことです。私たちの分析は最新の価格に敏感な会社の公告や定性材料を考慮しないかもしれないことに注意してください。Simply Wall St.上記のいずれの株に対しても在庫を持っていない.
 SZSE:200512収益と収入の歴史2022年11月4日
 したがって、ある会社の応算比率が負の場合、それは実際には良いこととされているが、その応計比率が正であれば、それは悪いことである。応算比率がゼロより高いことは懸念されないが,ある会社の課税比率が相対的に高い場合には注意すべきであると考えられる。注目すべきは、一般的に、高応計比率は短期利益にとって良い兆しではないという学術的証拠があることである

 SZSE:200512 Earnings and Revenue History November 4th 2022
 Therefore, it's actually considered a good thing when a company has a negative accrual ratio, but a bad thing if its accrual ratio is positive. While having an accrual ratio above zero is of little concern, we do think it's worth noting when a company has a relatively high accrual ratio. Notably, there is some academic evidence that suggests that a high accrual ratio is a bad sign for near-term profits, generally speaking.