
Earnings Grew Faster Than the Favorable 15% CAGR Delivered to Wabash National (NYSE:WNC) Shareholders Over the Last Three Years
Earnings Grew Faster Than the Favorable 15% CAGR Delivered to Wabash National (NYSE:WNC) Shareholders Over the Last Three Years
It hasn't been the best quarter for Wabash National Corporation (NYSE:WNC) shareholders, since the share price has fallen 15% in that time. But don't let that distract from the very nice return generated over three years. After all, the share price is up a market-beating 46% in that time.
In light of the stock dropping 13% in the past week, we want to investigate the longer term story, and see if fundamentals have been the driver of the company's positive three-year return.
While the efficient markets hypothesis continues to be taught by some, it has been proven that markets are over-reactive dynamic systems, and investors are not always rational. By comparing earnings per share (EPS) and share price changes over time, we can get a feel for how investor attitudes to a company have morphed over time.
Wabash National was able to grow its EPS at 165% per year over three years, sending the share price higher. The average annual share price increase of 13% is actually lower than the EPS growth. Therefore, it seems the market has moderated its expectations for growth, somewhat. This cautious sentiment is reflected in its (fairly low) P/E ratio of 4.64.
The image below shows how EPS has tracked over time (if you click on the image you can see greater detail).
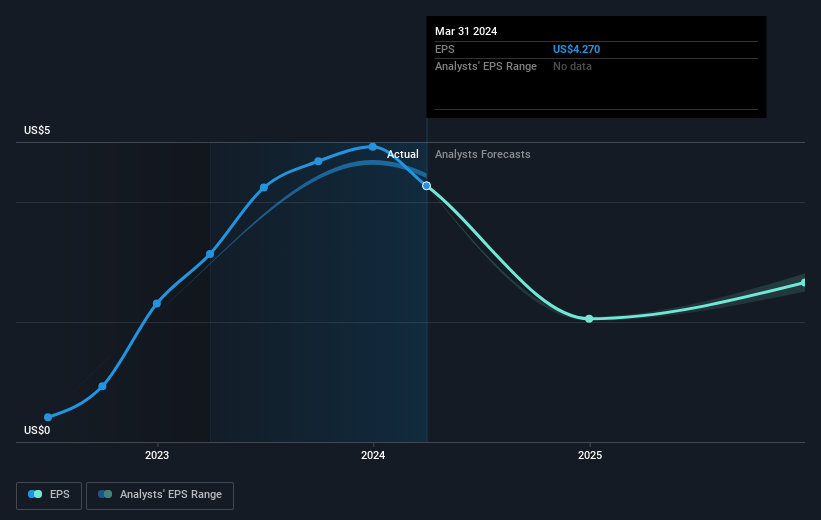
It is of course excellent to see how Wabash National has grown profits over the years, but the future is more important for shareholders. You can see how its balance sheet has strengthened (or weakened) over time in this free interactive graphic.
What About Dividends?
It is important to consider the total shareholder return, as well as the share price return, for any given stock. Whereas the share price return only reflects the change in the share price, the TSR includes the value of dividends (assuming they were reinvested) and the benefit of any discounted capital raising or spin-off. It's fair to say that the TSR gives a more complete picture for stocks that pay a dividend. In the case of Wabash National, it has a TSR of 53% for the last 3 years. That exceeds its share price return that we previously mentioned. This is largely a result of its dividend payments!
A Different Perspective
Investors in Wabash National had a tough year, with a total loss of 12% (including dividends), against a market gain of about 19%. However, keep in mind that even the best stocks will sometimes underperform the market over a twelve month period. Longer term investors wouldn't be so upset, since they would have made 7%, each year, over five years. If the fundamental data continues to indicate long term sustainable growth, the current sell-off could be an opportunity worth considering. I find it very interesting to look at share price over the long term as a proxy for business performance. But to truly gain insight, we need to consider other information, too. For example, we've discovered 3 warning signs for Wabash National (1 can't be ignored!) that you should be aware of before investing here.
If you like to buy stocks alongside management, then you might just love this free list of companies. (Hint: many of them are unnoticed AND have attractive valuation).
Please note, the market returns quoted in this article reflect the market weighted average returns of stocks that currently trade on American exchanges.
Have feedback on this article? Concerned about the content? Get in touch with us directly. Alternatively, email editorial-team (at) simplywallst.com.
This article by Simply Wall St is general in nature. We provide commentary based on historical data and analyst forecasts only using an unbiased methodology and our articles are not intended to be financial advice. It does not constitute a recommendation to buy or sell any stock, and does not take account of your objectives, or your financial situation. We aim to bring you long-term focused analysis driven by fundamental data. Note that our analysis may not factor in the latest price-sensitive company announcements or qualitative material. Simply Wall St has no position in any stocks mentioned.
Have feedback on this article? Concerned about the content? Get in touch with us directly. Alternatively, email editorial-team@simplywallst.com