

Key Insights
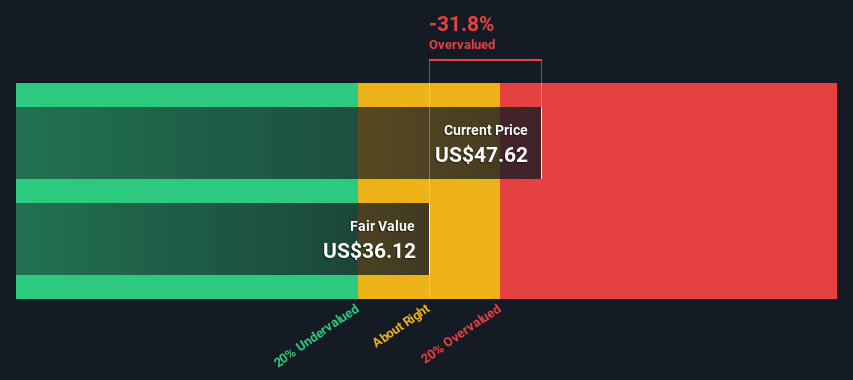
- Using the 2 Stage Free Cash Flow to Equity, Vericel fair value estimate is US$36.12
- Vericel is estimated to be 32% overvalued based on current share price of US$47.62
- Our fair value estimate is 36% lower than Vericel's analyst price target of US$56.57
How far off is Vericel Corporation (NASDAQ:VCEL) from its intrinsic value? Using the most recent financial data, we'll take a look at whether the stock is fairly priced by projecting its future cash flows and then discounting them to today's value. The Discounted Cash Flow (DCF) model is the tool we will apply to do this. Believe it or not, it's not too difficult to follow, as you'll see from our example!
Companies can be valued in a lot of ways, so we would point out that a DCF is not perfect for every situation. Anyone interested in learning a bit more about intrinsic value should have a read of the Simply Wall St analysis model.
The Method
We are going to use a two-stage DCF model, which, as the name states, takes into account two stages of growth. The first stage is generally a higher growth period which levels off heading towards the terminal value, captured in the second 'steady growth' period. In the first stage we need to estimate the cash flows to the business over the next ten years. Seeing as no analyst estimates of free cash flow are available to us, we have extrapolate the previous free cash flow (FCF) from the company's last reported value. We assume companies with shrinking free cash flow will slow their rate of shrinkage, and that companies with growing free cash flow will see their growth rate slow, over this period. We do this to reflect that growth tends to slow more in the early years than it does in later years.
A DCF is all about the idea that a dollar in the future is less valuable than a dollar today, so we discount the value of these future cash flows to their estimated value in today's dollars:
10-year free cash flow (FCF) estimate
| 2025 | 2026 | 2027 | 2028 | 2029 | 2030 | 2031 | 2032 | 2033 | 2034 | |
| Levered FCF ($, Millions) | US$27.4m | US$36.4m | US$45.0m | US$52.9m | US$59.7m | US$65.5m | US$70.5m | US$74.8m | US$78.5m | US$81.9m |
| Growth Rate Estimate Source | Est @ 45.87% | Est @ 32.86% | Est @ 23.75% | Est @ 17.37% | Est @ 12.91% | Est @ 9.79% | Est @ 7.60% | Est @ 6.07% | Est @ 5.00% | Est @ 4.25% |
| Present Value ($, Millions) Discounted @ 6.0% | US$25.9 | US$32.4 | US$37.8 | US$41.9 | US$44.7 | US$46.3 | US$47.0 | US$47.0 | US$46.6 | US$45.9 |
("Est" = FCF growth rate estimated by Simply Wall St)
Present Value of 10-year Cash Flow (PVCF) = US$416m
The second stage is also known as Terminal Value, this is the business's cash flow after the first stage. For a number of reasons a very conservative growth rate is used that cannot exceed that of a country's GDP growth. In this case we have used the 5-year average of the 10-year government bond yield (2.5%) to estimate future growth. In the same way as with the 10-year 'growth' period, we discount future cash flows to today's value, using a cost of equity of 6.0%.
Terminal Value (TV)= FCF2034 × (1 + g) ÷ (r – g) = US$82m× (1 + 2.5%) ÷ (6.0%– 2.5%) = US$2.4b
Present Value of Terminal Value (PVTV)= TV / (1 + r)10= US$2.4b÷ ( 1 + 6.0%)10= US$1.4b
The total value, or equity value, is then the sum of the present value of the future cash flows, which in this case is US$1.8b. To get the intrinsic value per share, we divide this by the total number of shares outstanding. Compared to the current share price of US$47.6, the company appears reasonably expensive at the time of writing. Remember though, that this is just an approximate valuation, and like any complex formula - garbage in, garbage out.
The Assumptions
Now the most important inputs to a discounted cash flow are the discount rate, and of course, the actual cash flows. Part of investing is coming up with your own evaluation of a company's future performance, so try the calculation yourself and check your own assumptions. The DCF also does not consider the possible cyclicality of an industry, or a company's future capital requirements, so it does not give a full picture of a company's potential performance. Given that we are looking at Vericel as potential shareholders, the cost of equity is used as the discount rate, rather than the cost of capital (or weighted average cost of capital, WACC) which accounts for debt. In this calculation we've used 6.0%, which is based on a levered beta of 0.842. Beta is a measure of a stock's volatility, compared to the market as a whole. We get our beta from the industry average beta of globally comparable companies, with an imposed limit between 0.8 and 2.0, which is a reasonable range for a stable business.
SWOT Analysis for Vericel
- Currently debt free.
- Balance sheet summary for VCEL.
- Expensive based on P/S ratio and estimated fair value.
- Shareholders have been diluted in the past year.
- What are analysts forecasting for VCEL?
- Annual earnings are forecast to grow faster than the American market.
- No apparent threats visible for VCEL.
Moving On:
Although the valuation of a company is important, it shouldn't be the only metric you look at when researching a company. It's not possible to obtain a foolproof valuation with a DCF model. Preferably you'd apply different cases and assumptions and see how they would impact the company's valuation. If a company grows at a different rate, or if its cost of equity or risk free rate changes sharply, the output can look very different. What is the reason for the share price exceeding the intrinsic value? For Vericel, we've put together three additional aspects you should explore:
- Risks: As an example, we've found 1 warning sign for Vericel that you need to consider before investing here.
- Future Earnings: How does VCEL's growth rate compare to its peers and the wider market? Dig deeper into the analyst consensus number for the upcoming years by interacting with our free analyst growth expectation chart.
- Other Solid Businesses: Low debt, high returns on equity and good past performance are fundamental to a strong business. Why not explore our interactive list of stocks with solid business fundamentals to see if there are other companies you may not have considered!
PS. The Simply Wall St app conducts a discounted cash flow valuation for every stock on the NASDAQGM every day. If you want to find the calculation for other stocks just search here.
Have feedback on this article? Concerned about the content? Get in touch with us directly. Alternatively, email editorial-team (at) simplywallst.com.
This article by Simply Wall St is general in nature. We provide commentary based on historical data and analyst forecasts only using an unbiased methodology and our articles are not intended to be financial advice. It does not constitute a recommendation to buy or sell any stock, and does not take account of your objectives, or your financial situation. We aim to bring you long-term focused analysis driven by fundamental data. Note that our analysis may not factor in the latest price-sensitive company announcements or qualitative material. Simply Wall St has no position in any stocks mentioned.
Have feedback on this article? Concerned about the content? Get in touch with us directly. Alternatively, email editorial-team@simplywallst.com