
Calculating The Intrinsic Value Of MedSci Healthcare Holdings Limited (HKG:2415)
Calculating The Intrinsic Value Of MedSci Healthcare Holdings Limited (HKG:2415)
 A DCF is all about the idea that a dollar in the future is less valuable than a dollar today, and so the sum of these future cash flows is then discounted to today's value:
 Key Insights
主要见解
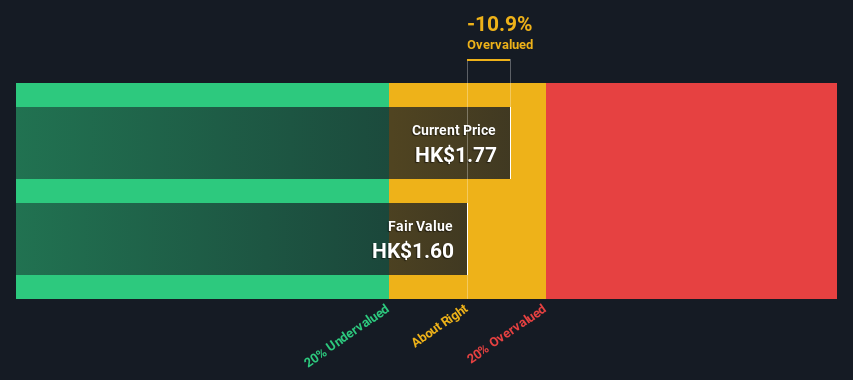
- The projected fair value for MedSci Healthcare Holdings is HK$1.60 based on 2 Stage Free Cash Flow to Equity
- With HK$1.77 share price, MedSci Healthcare Holdings appears to be trading close to its estimated fair value
- When compared to theindustry average discount of -4.0%, MedSci Healthcare Holdings' competitors seem to be trading at a lesser premium to fair value
- 基于2阶段自由现金流向股权的预期公允值,MedSci Healthcare Holdings的预期公允值为HK$1.60。
- 以HK$1.77的股价来看,MedSci Healthcare Holdings似乎接近其预期公允值的交易。
- 与行业平均折扣-4.0%相比,MedSci Healthcare Holdings的竞争对手似乎以较低的溢价交易。
How far off is MedSci Healthcare Holdings Limited (HKG:2415) from its intrinsic value? Using the most recent financial data, we'll take a look at whether the stock is fairly priced by taking the expected future cash flows and discounting them to their present value. We will use the Discounted Cash Flow (DCF) model on this occasion. There's really not all that much to it, even though it might appear quite complex.
MedSci Healthcare Holdings Limited (HKG:2415)的内在价值相差有多远?利用最新的财务数据,我们将查看该股票是否定价合理,这是通过预期未来现金流量,并将其贴现到其现值来完成的。这次我们将使用贴现现金流量(DCF)模型。实际上,并不是那么复杂,尽管看起来可能相当复杂。
We would caution that there are many ways of valuing a company and, like the DCF, each technique has advantages and disadvantages in certain scenarios. For those who are keen learners of equity analysis, the Simply Wall St analysis model here may be something of interest to you.
我们应该注意的是,估值的方法有很多种,就像DCF一样,每种技术在特定的情况下都有其优点和缺点。对于那些热爱股权分析的学习者来说,这里的 Simply Wall St 分析模型可能是一些感兴趣的内容。
Is MedSci Healthcare Holdings Fairly Valued?
MedSci Healthcare Holdings是否公平价值?
We are going to use a two-stage DCF model, which, as the name states, takes into account two stages of growth. The first stage is generally a higher growth period which levels off heading towards the terminal value, captured in the second 'steady growth' period. To start off with, we need to estimate the next ten years of cash flows. Seeing as no analyst estimates of free cash flow are available to us, we have extrapolate the previous free cash flow (FCF) from the company's last reported value. We assume companies with shrinking free cash flow will slow their rate of shrinkage, and that companies with growing free cash flow will see their growth rate slow, over this period. We do this to reflect that growth tends to slow more in the early years than it does in later years.
我们将采用两阶段折现现金流模型,就像名称所示,它会考虑到两个时期的增长。 第一个时期通常是一个增长较快的时期,随着进入第二个“平稳增长”时期的末期价值逐渐稳定。 首先,我们需要估算未来10年的现金流。鉴于我们没有分析师对自由现金流的预估,我们需要从公司上次公布的财务数据中推断出之前的自由现金流(FCF)。我们假设自由现金流萎缩的公司会减缓萎缩率,而自由现金流增长的公司将在此期间看到增长率减缓。我们这样做是为了反映增长在早期年份的放缓更甚于在后来的年份。
A DCF is all about the idea that a dollar in the future is less valuable than a dollar today, and so the sum of these future cash flows is then discounted to today's value:
DCF的核心概念是未来的每一美元都比现在的每一美元更不值钱,因此我们将这些未来的现金流贴现到当今的价值:
10-year free cash flow (FCF) forecast
10年自由现金流(FCF)预测
| 2025 | 2026 | 2027 | 2028 | 2029 | 2030 | 2031 | 2032 | 2033 | 2034 | |
| Levered FCF (CN¥, Millions) | CN¥38.0m | CN¥38.6m | CN¥39.3m | CN¥40.1m | CN¥40.9m | CN¥41.8m | CN¥42.7m | CN¥43.6m | CN¥44.6m | CN¥45.6m |
| Growth Rate Estimate Source | Est @ 1.39% | Est @ 1.65% | Est @ 1.83% | Est @ 1.95% | Est @ 2.04% | Est @ 2.10% | Est @ 2.15% | Est @ 2.18% | Est @ 2.20% | Est @ 2.22% |
| Present Value (CN¥, Millions) Discounted @ 7.0% | CN¥35.5 | CN¥33.7 | CN¥32.1 | CN¥30.6 | CN¥29.2 | CN¥27.8 | CN¥26.6 | CN¥25.4 | CN¥24.2 | CN¥23.1 |
| 2025 | 2026 | 2027 | 2028 | 2029 | 2030 | 2031 | 2032 | 2033 | 2034 | |
| 杠杆自由现金流量(人民币,百万) | 44.6百万人民币 | 45.6百万人民币 | CN¥35.5 | CN¥33.7 | 40.9百万元人民币 | CN¥30.6 | CN¥29.2 | CN¥27.8 | CN¥26.6 | CN¥25.4 |
| 增长率估计来源 | 预计@1.39% | @ 1.65%的预期增长率下的估值 | 估计 @ 1.83% | 预期 @ 1.95% | 预计涨幅为2.04%。 | 估计@2.10% | 预计为2.15% | 估计@2.18% | 以2.20%的速度为估算值 | 预计为2.22% |
| 33.7元人民币 |
("Est" = FCF growth rate estimated by Simply Wall St)
Present Value of 10-year Cash Flow (PVCF) = CN¥288m
("Est" = Simply Wall St 估计的自由现金流增长率)
After calculating the present value of future cash flows in the initial 10-year period, we need to calculate the Terminal Value, which accounts for all future cash flows beyond the first stage. For a number of reasons a very conservative growth rate is used that cannot exceed that of a country's GDP growth. In this case we have used the 5-year average of the 10-year government bond yield (2.3%) to estimate future growth. In the same way as with the 10-year 'growth' period, we discount future cash flows to today's value, using a cost of equity of 7.0%.
Terminal Value (TV)= FCF2034 × (1 + g) ÷ (r – g) = CN¥46m× (1 + 2.3%) ÷ (7.0%– 2.3%) = CN¥978m
Present Value of Terminal Value (PVTV)= TV / (1 + r)10= CN¥978m÷ ( 1 + 7.0%)10= CN¥496m
The total value, or equity value, is then the sum of the present value of the future cash flows, which in this case is CN¥784m. To get the intrinsic value per share, we divide this by the total number of shares outstanding. Compared to the current share price of HK$1.8, the company appears around fair value at the time of writing. The assumptions in any calculation have a big impact on the valuation, so it is better to view this as a rough estimate, not precise down to the last cent.
The Assumptions
假设
The calculation above is very dependent on two assumptions. The first is the discount rate and the other is the cash flows. You don't have to agree with these inputs, I recommend redoing the calculations yourself and playing with them. The DCF also does not consider the possible cyclicality of an industry, or a company's future capital requirements, so it does not give a full picture of a company's potential performance. Given that we are looking at MedSci Healthcare Holdings as potential shareholders, the cost of equity is used as the discount rate, rather than the cost of capital (or weighted average cost of capital, WACC) which accounts for debt. In this calculation we've used 7.0%, which is based on a levered beta of 0.957. Beta is a measure of a stock's volatility, compared to the market as a whole. We get our beta from the industry average beta of globally comparable companies, with an imposed limit between 0.8 and 2.0, which is a reasonable range for a stable business.
Looking Ahead:
展望未来:
Valuation is only one side of the coin in terms of building your investment thesis, and it is only one of many factors that you need to assess for a company. It's not possible to obtain a foolproof valuation with a DCF model. Preferably you'd apply different cases and assumptions and see how they would impact the company's valuation. For example, changes in the company's cost of equity or the risk free rate can significantly impact the valuation. For MedSci Healthcare Holdings, there are three pertinent elements you should further research:
- Risks: For instance, we've identified 1 warning sign for MedSci Healthcare Holdings that you should be aware of.
- Other Solid Businesses: Low debt, high returns on equity and good past performance are fundamental to a strong business. Why not explore our interactive list of stocks with solid business fundamentals to see if there are other companies you may not have considered!
- Other Top Analyst Picks: Interested to see what the analysts are thinking? Take a look at our interactive list of analysts' top stock picks to find out what they feel might have an attractive future outlook!
- 其他优秀企业:低负债,高股本回报率和良好的过去业绩是构建强大企业基础的基础。为什么不探索我们交互式的股票列表,其中包括具有坚实业务基础的其他公司?
- 其他分析师推荐:有兴趣看看分析师的想法吗?请查看我们的交互式分析师股票推荐列表,以了解他们认为哪些股票具有有吸引力的未来前景!
PS. The Simply Wall St app conducts a discounted cash flow valuation for every stock on the SEHK every day. If you want to find the calculation for other stocks just search here.
PS。Simply Wall St应用程序每天对SEHK上的每只股票进行折现现金流估值。如果您想找到其他股票的计算,请在这里搜索。
Have feedback on this article? Concerned about the content? Get in touch with us directly. Alternatively, email editorial-team (at) simplywallst.com.
This article by Simply Wall St is general in nature. We provide commentary based on historical data and analyst forecasts only using an unbiased methodology and our articles are not intended to be financial advice. It does not constitute a recommendation to buy or sell any stock, and does not take account of your objectives, or your financial situation. We aim to bring you long-term focused analysis driven by fundamental data. Note that our analysis may not factor in the latest price-sensitive company announcements or qualitative material. Simply Wall St has no position in any stocks mentioned.
对本文有任何反馈?对内容有任何疑虑?请直接与我们联系。或者,发送电子邮件至editorial-team@simplywallst.com。
这篇文章是Simply Wall St的一般性文章。我们根据历史数据和分析师预测提供评论,只使用公正的方法论,我们的文章并不意味着提供任何金融建议。文章不构成买卖任何股票的建议,也不考虑您的目标或您的财务状况。我们的目标是带给您基本数据驱动的长期关注分析。请注意,我们的分析可能不考虑最新的价格敏感公司公告或定性材料。Simply Wall St没有任何股票头寸。
