
Aisino Co.Ltd. (SHSE:600271) shareholders have had their patience rewarded with a 36% share price jump in the last month. Unfortunately, the gains of the last month did little to right the losses of the last year with the stock still down 13% over that time.
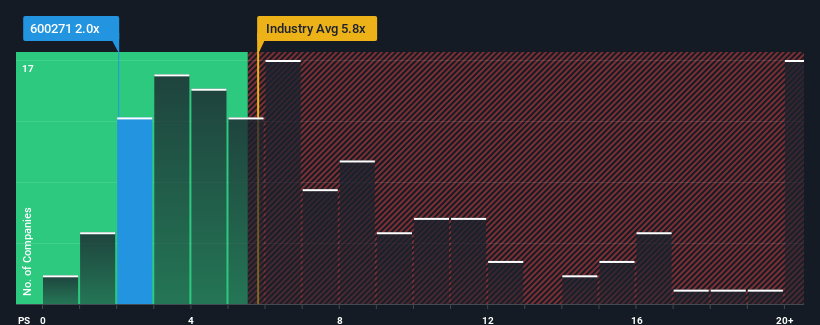
Even after such a large jump in price, AisinoLtd may still be sending very bullish signals at the moment with its price-to-sales (or "P/S") ratio of 2x, since almost half of all companies in the Software industry in China have P/S ratios greater than 5.8x and even P/S higher than 11x are not unusual. Although, it's not wise to just take the P/S at face value as there may be an explanation why it's so limited.
What Does AisinoLtd's Recent Performance Look Like?
While the industry has experienced revenue growth lately, AisinoLtd's revenue has gone into reverse gear, which is not great. Perhaps the P/S remains low as investors think the prospects of strong revenue growth aren't on the horizon. If you still like the company, you'd be hoping this isn't the case so that you could potentially pick up some stock while it's out of favour.
If you'd like to see what analysts are forecasting going forward, you should check out our free report on AisinoLtd.What Are Revenue Growth Metrics Telling Us About The Low P/S?
 There's an inherent assumption that a company should far underperform the industry for P/S ratios like AisinoLtd's to be considered reasonable.
Taking a look back first, the company's revenue growth last year wasn't something to get excited about as it posted a disappointing decline of 43%. The last three years don't look nice either as the company has shrunk revenue by 56% in aggregate. Therefore, it's fair to say the revenue growth recently has been undesirable for the company.
Looking ahead now, revenue is anticipated to climb by 27% during the coming year according to the one analyst following the company. Meanwhile, the rest of the industry is forecast to expand by 26%, which is not materially different.
With this in consideration, we find it intriguing that AisinoLtd's P/S is lagging behind its industry peers. Apparently some shareholders are doubtful of the forecasts and have been accepting lower selling prices.
What We Can Learn From AisinoLtd's P/S?
AisinoLtd's recent share price jump still sees fails to bring its P/S alongside the industry median. We'd say the price-to-sales ratio's power isn't primarily as a valuation instrument but rather to gauge current investor sentiment and future expectations.
Our examination of AisinoLtd's revealed that its P/S remains low despite analyst forecasts of revenue growth matching the wider industry. When we see middle-of-the-road revenue growth like this, we assume it must be the potential risks that are what is placing pressure on the P/S ratio. However, if you agree with the analysts' forecasts, you may be able to pick up the stock at an attractive price.
The company's balance sheet is another key area for risk analysis. Our free balance sheet analysis for AisinoLtd with six simple checks will allow you to discover any risks that could be an issue.
If you're unsure about the strength of AisinoLtd's business, why not explore our interactive list of stocks with solid business fundamentals for some other companies you may have missed.
Have feedback on this article? Concerned about the content? Get in touch with us directly. Alternatively, email editorial-team (at) simplywallst.com.
This article by Simply Wall St is general in nature. We provide commentary based on historical data and analyst forecasts only using an unbiased methodology and our articles are not intended to be financial advice. It does not constitute a recommendation to buy or sell any stock, and does not take account of your objectives, or your financial situation. We aim to bring you long-term focused analysis driven by fundamental data. Note that our analysis may not factor in the latest price-sensitive company announcements or qualitative material. Simply Wall St has no position in any stocks mentioned.
