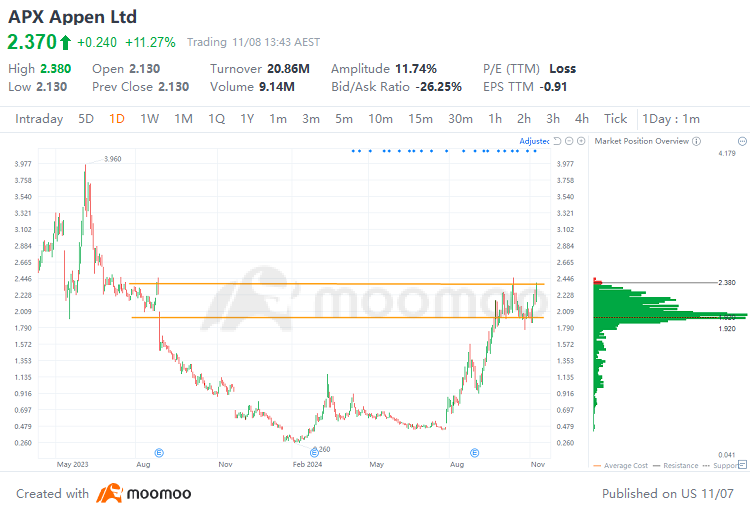
$Appen Ltd (APX.AU)$ shares rose 11.27% on Friday, with trading volume expanding to A$20.86 million. Appen has rose 21.87% over the past week, with a cumulative gain of 271.43% year-to-date.
Appen's technical analysis chart:
Technical Analysis:
Support: A$1.92
 Resistance: A$2.38
Price range A$1.92 to A$2.38: The trading range indicates a heavy concentration of buy orders, with the stock price on an upward trend. The stock repeatedly touched the level near A$1.92, where it found significant support and subsequently rebounded. There is a strong presence of buy orders around A$1.92, suggesting a robust foundation for the price. There is considerable upward pressure near the resistance level of A$2.38, with a lot of profit-taking positions, which suggests strong selling pressure. Going forward, it will be crucial to monitor whether the stock can effectively break through the resistance level at A$2.38.
Market News :
Appen announced the successful completion of its Share Purchase Plan (SPP) on November 1, 2024, following the closure of applications. The company had previously completed a fully underwritten institutional placement on October 14, 2024, valued at A$50 million. The SPP was met with strong support from eligible shareholders and was significantly oversubscribed, with Appen receiving approximately A$20.7 million in valid applications, substantially exceeding the target of A$5 million.
Overall Analysis:
Fundamentally, focus on the company's performance and operational status. Technically, it is necessary to monitor whether the stock price continues to stay within the upward channel, whether the support at the bottom of the channel remains valid, and whether the resistance level can be effectively broken through.
In this scenario, investors should adopt a cautious strategy, setting stop-loss points to manage risk and maintaining ongoing vigilance regarding company developments and market conditions.
$Appen Ltd (APX.AU)$ 金曜日にシェアは11.27%上昇し、取引量はA$2086万に拡大しました。Appenは過去1週間で21.87%上昇し、年初来で累積利益率271.43%を記録しています。
Appenのテクニカル分析チャート:
テクニカル分析:
ニュース:
Appenは、2024年11月1日に応募の締め切り後、シェア購入計画(SPP)の成功した完了を発表しました。会社は以前、2024年10月14日にA$5000万で完全引受け制度配置を完了しており、そのSPPは適格株主からの強力なサポートを受けて大きく過剰申込みとなり、Appenは約A$2070万の妥当な応募を受け取り、目標のA$500万を大幅に上回りました。
総合分析:
基本的には、企業の業績と運営状況に焦点を当てるべきです。技術的には、株価が上昇チャネル内に留まり続けているか、チャネルの底でのサポートが有効であるか、抵抗レベルが効果的に突破できるかを監視する必要があります。
このシナリオでは、投資家は慎重な戦略を採用するべきであり、リスクを管理するためにストップロスポイントを設定し、企業の動向や市場状況について継続的な警戒を保つべきです。

 レジスタンス: A$2.38

 Resistance: A$2.38