
Are Investors Undervaluing Envista Holdings Corporation (NYSE:NVST) By 21%?
Are Investors Undervaluing Envista Holdings Corporation (NYSE:NVST) By 21%?
 Generally we assume that a dollar today is more valuable than a dollar in the future, and so the sum of these future cash flows is then discounted to today's value:
 Key Insights
主要见解
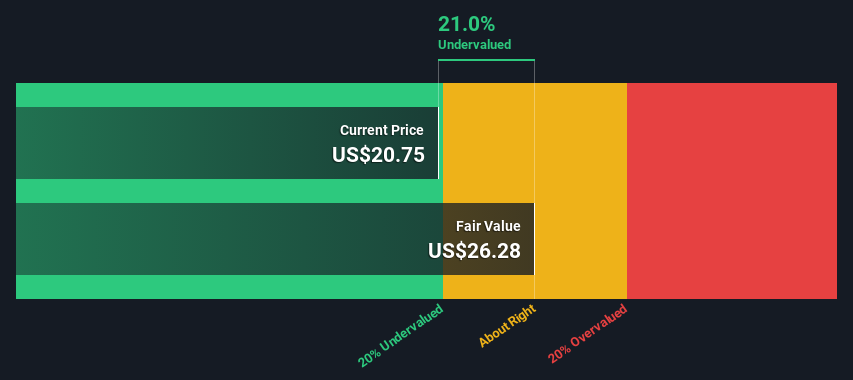
- Using the 2 Stage Free Cash Flow to Equity, Envista Holdings fair value estimate is US$26.28
- Envista Holdings' US$20.75 share price signals that it might be 21% undervalued
- The US$21.55 analyst price target for NVST is 18% less than our estimate of fair value
- 使用两阶段自由现金流向股本,Envista Holdings的公平价值估计为26.28美元。
- Envista Holdings的20.75美元股价表明它可能被低估了21%。
- NVSt的21.55美元分析师目标价格比我们的公平价值估计低18%。
In this article we are going to estimate the intrinsic value of Envista Holdings Corporation (NYSE:NVST) by estimating the company's future cash flows and discounting them to their present value. The Discounted Cash Flow (DCF) model is the tool we will apply to do this. Don't get put off by the jargon, the math behind it is actually quite straightforward.
在本文中,我们将通过估计公司未来现金流并将其贴现到现值来估算Envista Holdings Corporation(NYSE:NVST)的内在价值。折现现金流(DCF)模型是我们将应用于此目的的工具。不要被行话吓到,其背后的数学实际上非常简单。
Remember though, that there are many ways to estimate a company's value, and a DCF is just one method. If you want to learn more about discounted cash flow, the rationale behind this calculation can be read in detail in the Simply Wall St analysis model.
需要记住,估算公司价值有很多方法,而DCF只是其中的一种。如果您想了解更多有关折现现金流的知识,可以详细阅读Simply Wall St分析模型的理论基础。
What's The Estimated Valuation?
预估估值是多少?
We're using the 2-stage growth model, which simply means we take in account two stages of company's growth. In the initial period the company may have a higher growth rate and the second stage is usually assumed to have a stable growth rate. To begin with, we have to get estimates of the next ten years of cash flows. Where possible we use analyst estimates, but when these aren't available we extrapolate the previous free cash flow (FCF) from the last estimate or reported value. We assume companies with shrinking free cash flow will slow their rate of shrinkage, and that companies with growing free cash flow will see their growth rate slow, over this period. We do this to reflect that growth tends to slow more in the early years than it does in later years.
我们使用2阶段增长模型,这意味着我们考虑公司的两个增长阶段。在最初的阶段,公司的增长率可能会更高,在第二个阶段通常被认为具有稳定的增长率。首先,我们必须获得未来十年的现金流量预测值。在可能的情况下,我们使用分析师的预测,但当这些不可用时,我们将推算出前期股息的自由现金流(FCF)。我们假设自由现金流减少的公司将减缓其减少速度,并且自由现金流增加的公司将在此期间看到其增长率减缓。我们这样做是为了反映增长在早期年份比后来的年份更容易放缓的现象。
Generally we assume that a dollar today is more valuable than a dollar in the future, and so the sum of these future cash flows is then discounted to today's value:
通常我们认为今天的一美元比未来的一美元更有价值,因此这些未来的现金流的总和被贴现到今天的价值。
10-year free cash flow (FCF) estimate
10年自由现金流 (FCF) 预估值
| 2025 | 2026 | 2027 | 2028 | 2029 | 2030 | 2031 | 2032 | 2033 | 2034 | |
| Levered FCF ($, Millions) | US$214.0m | US$240.0m | US$237.6m | US$237.8m | US$239.8m | US$243.1m | US$247.4m | US$252.3m | US$257.9m | US$263.9m |
| Growth Rate Estimate Source | Analyst x3 | Analyst x2 | Est @ -1.00% | Est @ 0.09% | Est @ 0.85% | Est @ 1.38% | Est @ 1.75% | Est @ 2.01% | Est @ 2.19% | Est @ 2.32% |
| Present Value ($, Millions) Discounted @ 7.3% | US$199 | US$208 | US$192 | US$179 | US$169 | US$159 | US$151 | US$144 | US$137 | US$130 |
| 2025 | 2026 | 2027 | 2028 | 2029 | 2030 | 2031 | 2032 | 2033 | 2034 | |
| 杠杆自由现金流 ($, 百万) | 2.14亿美元 | 240.0百万美元 | 237.6百万美元 | 2.378亿美元 | 239.8百万美元 | 美元243.1m | 247.4百万美元 | 252.3百万美元 | 257.9百万美元 | 263.9百万美元 |
| 增长率估计来源 | 分析师 x3 | 分析师 x2 | Est @ -1.00% | 估值增长率为0.09% | 预估上涨0.85% | 以1.38%为基础估算 | @1.75%的估算 | 估计为2.01% | 预计为2.19% | 以2.32%的速度为估算值 |
| 以7.3%的折现率折现的现值($,百万) | 美元199 | 208美元 | 192美元 | 美元179 | 169美元 | 159美元 | 151美元 | 144美元 | 137美元 | 美元130 |
("Est" = FCF growth rate estimated by Simply Wall St)
Present Value of 10-year Cash Flow (PVCF) = US$1.7b
("Est" = Simply Wall St 估计的自由现金流增长率)
10年现金流(PVCF)的现值=美元1.7b
We now need to calculate the Terminal Value, which accounts for all the future cash flows after this ten year period. For a number of reasons a very conservative growth rate is used that cannot exceed that of a country's GDP growth. In this case we have used the 5-year average of the 10-year government bond yield (2.6%) to estimate future growth. In the same way as with the 10-year 'growth' period, we discount future cash flows to today's value, using a cost of equity of 7.3%.
我们现在需要计算终结价值,这涵盖了这十年期间之后所有未来现金流。 由于种种原因,我们使用了一种不能超过国家GDP增长率的非常保守的增长率。在这种情况下,我们使用了10年期政府债券收益率(2.6%)的5年平均值来估算未来增长。与持续10年的'增长'期一样,我们使用7.3%的权益成本将未来现金流贴现到今天的价值。
Terminal Value (TV)= FCF2034 × (1 + g) ÷ (r – g) = US$264m× (1 + 2.6%) ÷ (7.3%– 2.6%) = US$5.8b
终值(TV)= FCF2034 × (1 + g) ÷ (r – g) = 2.64亿美元 × (1 + 2.6%) ÷ (7.3%– 2.6%) = 58亿美元
Present Value of Terminal Value (PVTV)= TV / (1 + r)10= US$5.8b÷ ( 1 + 7.3%)10= US$2.9b
终值现值(PVTV)= TV / (1 + r)10= 58亿美元÷ ( 1 + 7.3%)10= 29亿美元
The total value, or equity value, is then the sum of the present value of the future cash flows, which in this case is US$4.5b. The last step is to then divide the equity value by the number of shares outstanding. Relative to the current share price of US$20.8, the company appears a touch undervalued at a 21% discount to where the stock price trades currently. Valuations are imprecise instruments though, rather like a telescope - move a few degrees and end up in a different galaxy. Do keep this in mind.
总价值,或股权价值,是未来现金流的现值之和,本例中为45亿美元。然后将股权价值除以未来现有股份数量。相对于当前股价20.8美元,公司似乎略显低估,折价21%,低于目前股价水平。估值是不精确的工具,有点像望远镜——稍微移动几度就会到达另一个星系。牢记此点。
Important Assumptions
重要假设
We would point out that the most important inputs to a discounted cash flow are the discount rate and of course the actual cash flows. You don't have to agree with these inputs, I recommend redoing the calculations yourself and playing with them. The DCF also does not consider the possible cyclicality of an industry, or a company's future capital requirements, so it does not give a full picture of a company's potential performance. Given that we are looking at Envista Holdings as potential shareholders, the cost of equity is used as the discount rate, rather than the cost of capital (or weighted average cost of capital, WACC) which accounts for debt. In this calculation we've used 7.3%, which is based on a levered beta of 1.138. Beta is a measure of a stock's volatility, compared to the market as a whole. We get our beta from the industry average beta of globally comparable companies, with an imposed limit between 0.8 and 2.0, which is a reasonable range for a stable business.
我们要指出,现金流折现的最重要输入是折现率和当然实际现金流。您不必同意这些输入,我建议重新进行计算并尝试调整。现金流折现也不考虑行业的可能周期性,或公司未来的资本需求,因此并不能全面展示公司的潜在表现。鉴于我们是潜在的Envista Holdings股东,成本权益被用作折现率,而不是资本成本(或加权平均资本成本,WACC)考虑了债务。在这个计算中,我们使用了7.3%,这基于1.138的杠杆化贝塔。贝塔是衡量股票波动性的指标,与整个市场相比。我们从环球可比公司的行业平均贝塔中获得我们的贝塔,该贝塔的范围在0.8到2.0之间,这对于稳定的企业是一个合理的范围。
Looking Ahead:
展望未来:
Although the valuation of a company is important, it shouldn't be the only metric you look at when researching a company. DCF models are not the be-all and end-all of investment valuation. Instead the best use for a DCF model is to test certain assumptions and theories to see if they would lead to the company being undervalued or overvalued. If a company grows at a different rate, or if its cost of equity or risk free rate changes sharply, the output can look very different. Can we work out why the company is trading at a discount to intrinsic value? For Envista Holdings, there are three further items you should explore:
尽管公司的估值很重要,但在研究一家公司时,它不应该是您关注的唯一指标。贴现现金流模型并非投资估值的全部和终极标准。相反,DCF模型的最佳用途是测试某些假设和理论,以查看它们是否会导致公司被低估或高估。如果一家公司的增长速度不同,或者其权益成本或无风险利率发生了急剧变化,输出可能看起来非常不同。我们能够解释为什么该公司的股价低于内在价值吗?对于envista holdings,还有其他三个项目您应该探讨:
- Financial Health: Does NVST have a healthy balance sheet? Take a look at our free balance sheet analysis with six simple checks on key factors like leverage and risk.
- Management:Have insiders been ramping up their shares to take advantage of the market's sentiment for NVST's future outlook? Check out our management and board analysis with insights on CEO compensation and governance factors.
- Other Solid Businesses: Low debt, high returns on equity and good past performance are fundamental to a strong business. Why not explore our interactive list of stocks with solid business fundamentals to see if there are other companies you may not have considered!
- 财务健康:NVSt是否拥有健康的资产负债表?查看我们免费的资产负债表分析,关注关键因素如杠杆和风险等六个简单检查项。
- 管理:内部人员是否一直在增加他们的股份以利用市场对NVST未来前景的看法?查看我们的管理层和董事会分析,以了解首席执行官薪酬和公司治理等因素。
- 其他优秀企业:低负债,高股本回报率和良好的过去业绩是构建强大企业基础的基础。为什么不探索我们交互式的股票列表,其中包括具有坚实业务基础的其他公司?
PS. The Simply Wall St app conducts a discounted cash flow valuation for every stock on the NYSE every day. If you want to find the calculation for other stocks just search here.
PS。Simply Wall St应用程序每天为纽约证券交易所的每只股票进行折现现金流估值。如果您想查找其他股票的计算,请在此处搜索。
Have feedback on this article? Concerned about the content? Get in touch with us directly. Alternatively, email editorial-team (at) simplywallst.com.
This article by Simply Wall St is general in nature. We provide commentary based on historical data and analyst forecasts only using an unbiased methodology and our articles are not intended to be financial advice. It does not constitute a recommendation to buy or sell any stock, and does not take account of your objectives, or your financial situation. We aim to bring you long-term focused analysis driven by fundamental data. Note that our analysis may not factor in the latest price-sensitive company announcements or qualitative material. Simply Wall St has no position in any stocks mentioned.
对这篇文章有反馈吗?对内容感到担忧吗?请直接与我们联系。或者,发送电子邮件至editorial-team @ simplywallst.com。
Simply Wall St的这篇文章是一般性质的。我们仅基于历史数据和分析师预测提供评论,使用公正的方法,我们的文章并非意在提供财务建议。这并不构成买入或卖出任何股票的建议,并且不考虑您的目标或财务状况。我们旨在为您带来基于基础数据驱动的长期聚焦分析。请注意,我们的分析可能未考虑最新的价格敏感公司公告或定性材料。Simply Wall St对提及的任何股票都没有持仓。
