
FAWER Automotive Parts Limited Company (SZSE:000030) Stock Is Going Strong But Fundamentals Look Uncertain: What Lies Ahead ?
FAWER Automotive Parts Limited Company (SZSE:000030) Stock Is Going Strong But Fundamentals Look Uncertain: What Lies Ahead ?
 Return on Equity = Net Profit (from continuing operations) ÷ Shareholders' Equity
 Most readers would already be aware that FAWER Automotive Parts Limited's (SZSE:000030) stock increased significantly by 16% over the past three months. But the company's key financial indicators appear to be differing across the board and that makes us question whether or not the company's current share price momentum can be maintained. In this article, we decided to focus on FAWER Automotive Parts Limited's ROE.
多数读者可能已经注意到,富奥b(SZSE:000030)股票在过去三个月里大幅上涨了16%。但该公司的关键财务指标似乎存在差异,这让我们开始质疑该公司当前的股价动能是否能够维持。在本文中,我们决定关注富奥b的roe。
Return on equity or ROE is an important factor to be considered by a shareholder because it tells them how effectively their capital is being reinvested. Put another way, it reveals the company's success at turning shareholder investments into profits.
ROE(净资产收益率)是股东需考虑的一个重要因素,因为它告诉他们资本被有效地再投资的效果如何。换句话说,它揭示了公司将股东的投资转化为利润的成功程度。
How Is ROE Calculated?
净资产收益率怎么计算?
Return on equity can be calculated by using the formula:
股东权益报酬率可以使用以下公式计算:
Return on Equity = Net Profit (from continuing operations) ÷ Shareholders' Equity
净资产收益率 = 净利润(来自持续经营) ÷ 股东权益
So, based on the above formula, the ROE for FAWER Automotive Parts Limited is:
所以,根据上述公式,富奥b的roe为:
10% = CN¥922m ÷ CN¥9.0b (Based on the trailing twelve months to September 2024).
10% = 92200万元 ÷ 90亿人民币(基于截至2024年9月的最近十二个月)。
The 'return' refers to a company's earnings over the last year. That means that for every CN¥1 worth of shareholders' equity, the company generated CN¥0.10 in profit.
“回报”是指公司在过去一年的盈利。这意味着对于每1元股东权益价值,公司产生了0.10元的利润。
What Is The Relationship Between ROE And Earnings Growth?
What Is The Relationship Between ROE And Earnings Growth?
We have already established that ROE serves as an efficient profit-generating gauge for a company's future earnings. We now need to evaluate how much profit the company reinvests or "retains" for future growth which then gives us an idea about the growth potential of the company. Generally speaking, other things being equal, firms with a high return on equity and profit retention, have a higher growth rate than firms that don't share these attributes.
我们已经确定,ROE是公司未来赚钱能力的有效衡量标准。现在我们需要评估公司为未来增长而再投资或“保留”的利润。这样,我们就能了解公司的增长潜力。一般而言,在其他条件相等的情况下,具有高净资产收益率和利润保留率的公司,比那些不具备这些特点的公司有更高的增长率。
A Side By Side comparison of FAWER Automotive Parts Limited's Earnings Growth And 10% ROE
富奥b汽车零部件有限公司的盈利增长和10%的roe进行了侧面比较
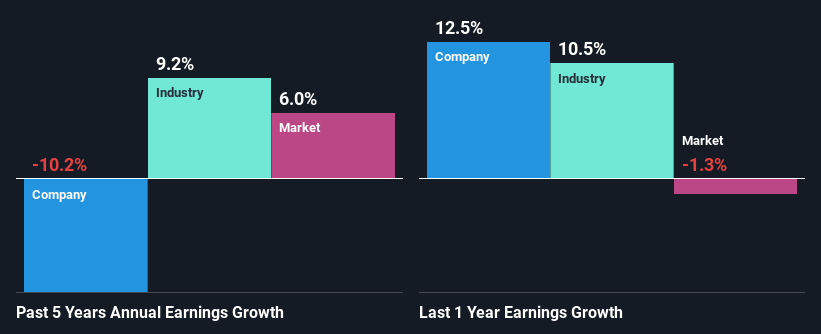
On the face of it, FAWER Automotive Parts Limited's ROE is not much to talk about. However, the fact that the its ROE is quite higher to the industry average of 8.3% doesn't go unnoticed by us. However, FAWER Automotive Parts Limited's five year net income decline rate was 10%. Bear in mind, the company does have a slightly low ROE. It is just that the industry ROE is lower. Hence, this goes some way in explaining the shrinking earnings.
乍一看,富奥b汽车零部件有限公司的roe并不值得一提。然而,其roe相当高于行业平均值8.3%的事实未被我们忽视。然而,富奥b汽车零部件有限公司的五年净利润下降率为10%。请记住,该公司的roe略低。仅仅是行业roe较低。因此,这在一定程度上解释了收益的下降。
So, as a next step, we compared FAWER Automotive Parts Limited's performance against the industry and were disappointed to discover that while the company has been shrinking its earnings, the industry has been growing its earnings at a rate of 9.2% over the last few years.
因此,作为下一步,我们将富奥b汽车零部件有限公司的绩效与行业进行了比较,并发现,尽管公司一直在缩减其收益,但行业在过去几年中的收益增长率为9.2%。
The basis for attaching value to a company is, to a great extent, tied to its earnings growth. What investors need to determine next is if the expected earnings growth, or the lack of it, is already built into the share price. This then helps them determine if the stock is placed for a bright or bleak future. One good indicator of expected earnings growth is the P/E ratio which determines the price the market is willing to pay for a stock based on its earnings prospects. So, you may want to check if FAWER Automotive Parts Limited is trading on a high P/E or a low P/E, relative to its industry.
股票的价值很大程度上取决于其盈利增长。投资者需要判断的是,预期的盈利增长是否已经反映在股价中,或者还没有反映。这有助于他们判断股票是面临光明未来还是暗淡未来。一个展示预期盈利增长的好指标是市盈率,它根据盈利前景确定市场愿意为股票支付的价格。因此,您可能会想要检查下富奥b股票的市盈率是高还是低,相对于其所在的行业板块。
Is FAWER Automotive Parts Limited Making Efficient Use Of Its Profits?
富奥b公司是否有效利用其利润?
With a high three-year median payout ratio of 71% (implying that 29% of the profits are retained), most of FAWER Automotive Parts Limited's profits are being paid to shareholders, which explains the company's shrinking earnings. The business is only left with a small pool of capital to reinvest - A vicious cycle that doesn't benefit the company in the long-run. To know the 3 risks we have identified for FAWER Automotive Parts Limited visit our risks dashboard for free.
三年内的中位数高达71%的分红比率(暗示29%的利润被留存),富奥b公司大部分利润都被支付给股东,这解释了公司利润的减少。该业务仅剩下少量资本可以再投资,这是一个长期内并不有利于公司的恶性循环。要了解我们为富奥b公司确定的三个风险,请免费访问我们的风险仪表板。
In addition, FAWER Automotive Parts Limited has been paying dividends over a period of at least ten years suggesting that keeping up dividend payments is way more important to the management even if it comes at the cost of business growth.
此外,富奥b公司至少连续十年支付股息,表明即使以牺牲业务增长为代价,保持支付股息对管理层来说更为重要。
Summary
总结
On the whole, we feel that the performance shown by FAWER Automotive Parts Limited can be open to many interpretations. On the one hand, the company does have a decent rate of return, however, its earnings growth number is quite disappointing and as discussed earlier, the low retained earnings is hampering the growth. Until now, we have only just grazed the surface of the company's past performance by looking at the company's fundamentals. You can do your own research on FAWER Automotive Parts Limited and see how it has performed in the past by looking at this FREE detailed graph of past earnings, revenue and cash flows.
总的来说,我们认为富奥b股份有限公司的表现可以有许多解读。一方面,公司确实有一个不错的roe率,但是其净利润增长数字相当令人失望,并且,正如之前讨论的,低保留收益正在阻碍增长。直到现在,我们只是浅尝辄止地通过查看公司的基本面来了解公司过去的表现。您可以通过查看这个免费详细的过去净利润、营业收入和现金流的图表,自行研究富奥b汽车零部件有限公司的业绩表现。
Have feedback on this article? Concerned about the content? Get in touch with us directly. Alternatively, email editorial-team (at) simplywallst.com.
This article by Simply Wall St is general in nature. We provide commentary based on historical data and analyst forecasts only using an unbiased methodology and our articles are not intended to be financial advice. It does not constitute a recommendation to buy or sell any stock, and does not take account of your objectives, or your financial situation. We aim to bring you long-term focused analysis driven by fundamental data. Note that our analysis may not factor in the latest price-sensitive company announcements or qualitative material. Simply Wall St has no position in any stocks mentioned.
对这篇文章有反馈吗?对内容感到担忧吗?请直接与我们联系。或者,发送电子邮件至editorial-team @ simplywallst.com。
Simply Wall St的这篇文章是一般性质的。我们仅基于历史数据和分析师预测提供评论,使用公正的方法,我们的文章并非意在提供财务建议。这并不构成买入或卖出任何股票的建议,并且不考虑您的目标或财务状况。我们旨在为您带来基于基础数据驱动的长期聚焦分析。请注意,我们的分析可能未考虑最新的价格敏感公司公告或定性材料。Simply Wall St对提及的任何股票都没有持仓。
