Alibaba stock forms powerful reversal pattern: what's next?
Alibaba stock forms powerful reversal pattern: what's next?
$Alibaba Group Holding Ltd(BABA.US)$ is down over 40% from its October 2020 all-time high of $319.32. China-based stocks have taken a beating from the Chinese government, which continues to crack down on companies trading on U.S. exchanges, and worsening U.S./China relations has rubbed salt on the wounds.
$阿里巴巴集團控股有限公司(BABA.US)$與2020年10月創下的319.32美元的歷史最高紀錄相比,下跌了40%以上。中國股市受到中國政府的打擊,中國政府繼續打擊在美國交易所交易的公司,美中關係的惡化在傷口上撒了鹽。
On Tuesday U.S. Defense Secretary Lloyd Austin, in a speech from Singapore, said the U.S. is committed to having a constructive relationship with China. There’s hope Austin’s comment will act as a starting point for the two countries to begin mending tensions.
週二,美國國防部長勞埃德·奧斯汀,在演講中他在新加坡表示,美國致力於與中國建立建設性的關係。奧斯汀的評論有望成為兩國開始修復緊張關係的起點。
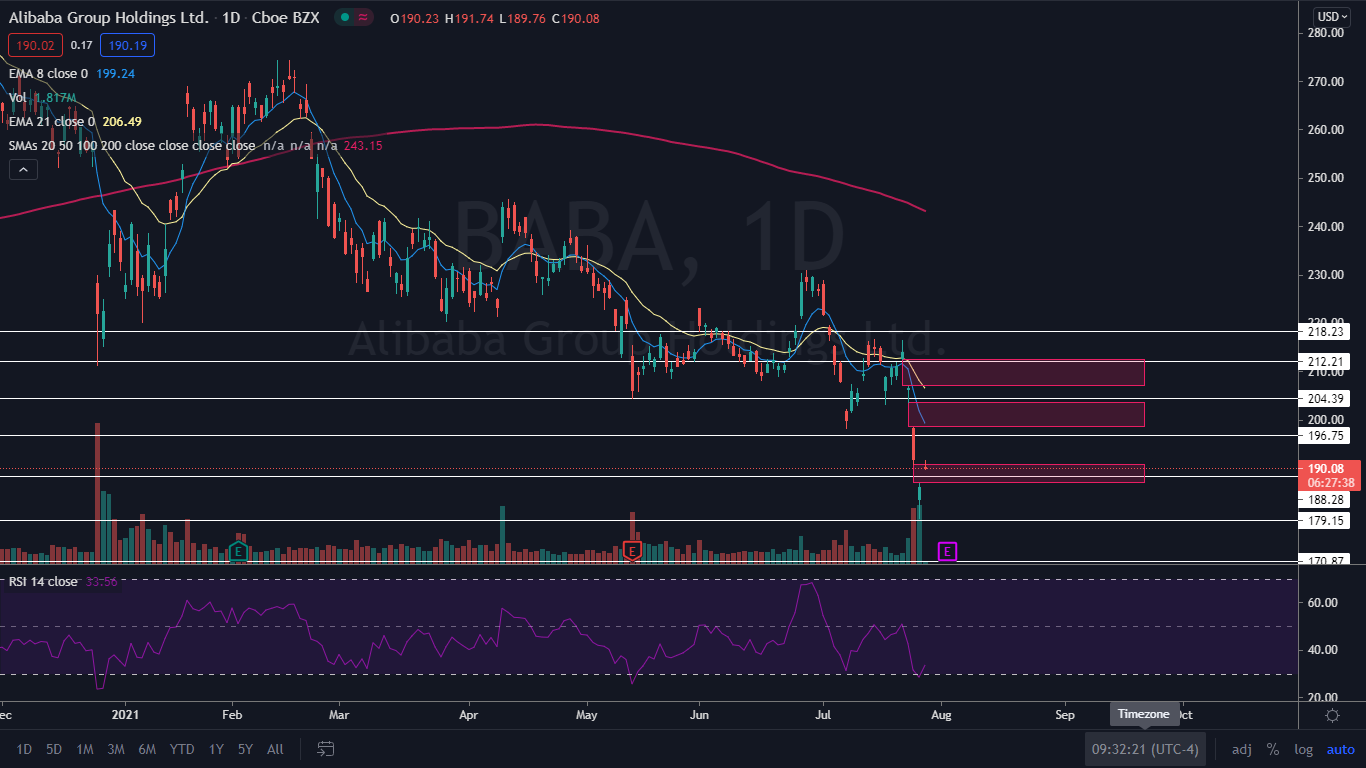
The Alibaba Chart: Alibaba’s steep and drastic sell-off may have culminated on Tuesday when the stock printed the final candle of a Sanku pattern.
阿里巴巴圖表:阿里巴巴的大幅拋售可能在週二達到頂峯,當時該股印製了三庫圖案的最後一支蠟燭。
The Sanku reversal pattern consists of three gaps, in either direction, which exhausts either the bulls or the bears and marks the point where the stock price reverses. Alibaba’s stock gapped down on Friday, Monday and Tuesday and subsequent price action failed to fill any of the gaps.
三庫反轉形態由三個缺口組成,兩個方向都有,這讓多頭或空頭筋疲力盡,並標誌着股價反轉的點。阿里巴巴的股價在週五、週一和週二出現下跌,隨後的價格走勢未能填補任何缺口。
Alibaba also printed a bullish green hammer candlestick. This candlestick, especially at the bottom of a Sanku pattern, adds to the bullish thesis a reversal is imminent.
阿里巴巴還印了一個看漲的綠色錘子燭台。這個燭台,特別是在三股形態的底部,增加了看漲觀點,反轉迫在眉睫。
Alibaba’s relative strength index (RSI) fell below 30% on Tuesday, which also indicates a bounce is in the cards. When Alibaba’s RSI fell below 30% on May 13, the stock bounced up 6.24% over the following five days.
週二,阿里巴巴的相對強弱指數(RSI)跌至30%以下,這也表明阿里巴巴有望反彈。5月13日,當阿里巴巴的RSI跌破30%時,該股在接下來的五天裏反彈了6.24%。
The stock is trading well below both the eight-day and 21-day exponential moving averages with the eight-day EMA trending below the 21-day EMA, both of which are bearish indicators. Alibaba is also trading down almost 25% below the 200-day simple moving average which indicates overall sentiment in the stock is bearish. Because Alibaba is too extended from the three moving averages, a bounce is likely needed to allow at least the eight-day EMA to catch up.
該股目前遠低於8日和21日指數移動均線,其中8日均線傾向於低於21日均線,這兩個指標都是看跌指標。阿里巴巴的股價也比200日簡單移動均線低了近25%,這表明該股的整體人氣是悲觀的。由於阿里巴巴距離三條移動均線的距離太遠,可能需要反彈,才能讓至少8日均線迎頭趕上。
Bulls want to see the Sanku reversal pattern recognized and for Alibaba’s stock to bounce up and regain support at $196. Above the level it has further resistance at $204 and $212.
Bears want to see big bearish volume continue to pressure Alibaba’s stock to the downside. If the stock loses support at $188, it could fall toward $179 again before bouncing.
看漲人士希望看到三庫反轉格局得到認可,希望阿里巴巴股價反彈,並在196美元處重新獲得支撐。在該水準上方,在204美元和212美元有進一步阻力。
看跌人士希望看到大量看跌行情繼續打壓阿里巴巴股價下跌。如果該股在188美元失守支撐,它可能會在反彈之前再次跌向179美元。

