NFT stands for Non-Fungible Token. It is a digital asset that can be identified through its unique qualities held within its metadata. Due to the way they are designed and minted, NFTs are unique and cannot be replaced, altered, or changed in any way. Once they have been created, they will be permanently etched on the blockchain’s public ledger for all to see. The NFT concept includes major US-listed companies that engage in the NFT industry.
- 812.566
- -0.583-0.07%
- 5D
- Daily
- Weekly
- Monthly
- 1Q
- 1Y
News
Bitcoin Erases Christmas Gains Even as MicroStrategy Beefs up Buying Push
KULR Invests $21 Million in Bitcoin as Part of Treasury Strategy
This Is What Whales Are Betting On Alibaba Gr Hldgs
Today's Pre-Market Movers and Top Ratings | GME, MSTR, SBUX, and More
US Morning News Call | Bitcoin Falls Despite MicroStrategy's Intent to Issue More Shares
Sanctions? Russia Is Now Using Bitcoin for International Trade
Comments
Gapping up
$GameStop (GME.US)$ shares surged over 4%, building on Tuesday's momentum. The video game retailer has experienced gains for four consecutive days, skyrocketing more than 77% year-to-date in 2024.
Shares of $Zoomcar Holdings (ZCAR.US)$ surged in pre-market trading today after the company reported a 43% year-over-year increase in bookings for November 2024, fueled largely by heightened demand during the w...
On 12/23/24
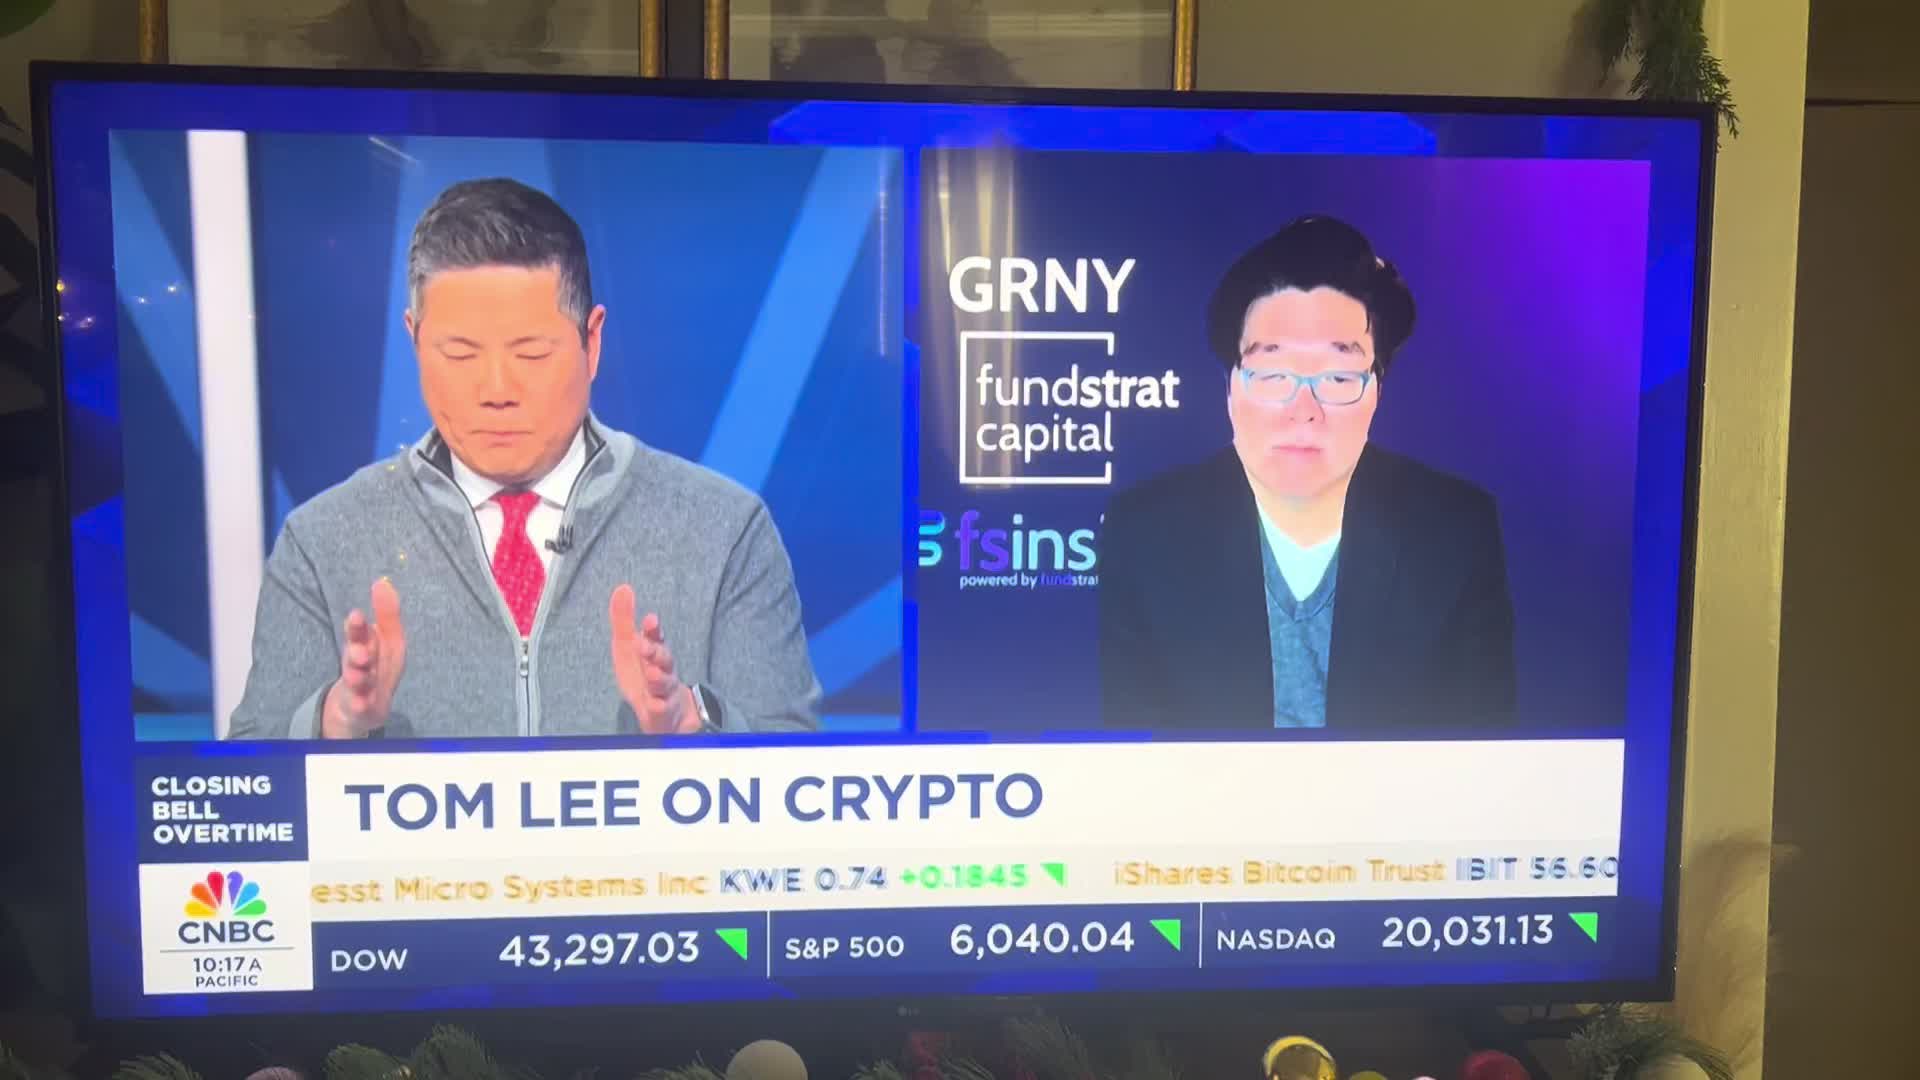
Tom Lee believes $MicroStrategy (MSTR.US)$ , $Semler Scientific (SMLR.US)$ and $Coinbase (COIN.US)$ could continue to be winners next year thanks to a more friendly crypto regulatory environment. If this man puts Seneler Scientific over bitcoin miners, that should speak volume. This stock is still below 1billion market cap. Its still not in Wall Street radar for now. Semler Scientific is not $Bitcoin (BTC.CC)$ miner and its m...


MARKET-TEST-DUMMY OP : CIT Wins CES 2025 Innovation Award for Transparent Antenna
Revolutionary Transparent Antenna with U
https://www.moomoo.com/t/news/post/47539148/zrqaEvEvEf
淡定的惠特莫爾 MARKET-TEST-DUMMY OP : I thought she was a handsome guy .
.