ESG stands for Environment, Social Responsibility, and Corporate Governance. The ESG concept includes the top 100 US-listed companies in terms of ESG rankings.
- 1380.438
- -30.243-2.14%
- 5D
- Daily
- Weekly
- Monthly
- 1Q
- 1Y
News
Bank of England Holds Interest Rates Steady at 4.75% as Price Pressure Lingers
EPA Clears California Ban on New Gas-powered Car Sales, Trump Likely to Block Move
Dow Dips Over 1,100 Points, Falling For 10th Session As Powell Adopts Hawkish Stance: Greed Index Moves To 'Fear' Zone
Reported Earlier, Woodside Reshapes Portfolio With Chevron Asset Swap, Gaining LNG And CCS Project Interests
Apple Reportedly In Talks With Tencent, TikTok-Parent ByteDance To Roll Out AI Features In China
Apple sharply criticized Meta for taking advantage, but this time the EU sided with Meta.
① Apple criticized Meta on Wednesday for repeatedly requesting access to software tools on iPhone devices, stating that this would affect user privacy and security; ② Apple warned that Meta has made a total of 15 interoperability requests, and if allowed, Meta could read all information from users on Apple devices; ③ The European Union has requested Apple to provide feedback on the relevant requests so that application developers can better understand iOS components.
Comments
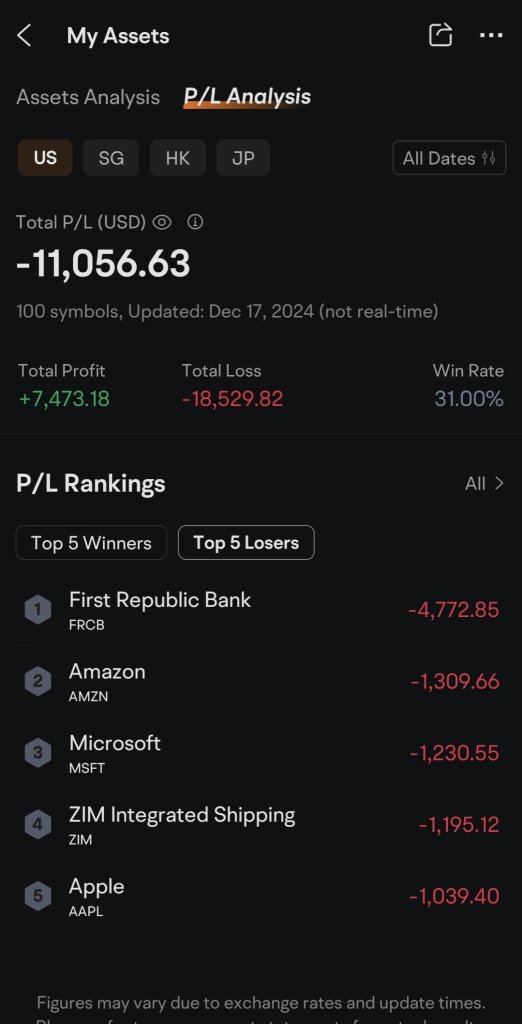
Here is how it happened!
Those stocks I invested below normally go up slowly but went down fast, and I caught on top buying expensive one and selling out with a loss (stop loss) in 2022-23.
I am now trading only options because I lost all my investment funds during the bear run. (I sold out all with loss because of fear of holding dipping stocks)
After losing more than 10 K++, I learn...


Rewarding Portfolio
The most rewarding highlight of my investment journey this year was achieving a YTD return of 87%. As someone who typically prefers caution and doesn’t like to jinx or overly cel...


 when it’s available
103356508CPC : You have to find the best companies first. This is already very hard because a company appears to be good can become a piece of shit overnight. Buy only one or a few stocks at the low enough price. If the price goes up, wait until you have significant profit before adding some more. The unrealised profit protact you from too much loss if the price goes down.
If the price goes down after you bought one or a few shares, wait until the price hit the bottom or went low enough. Buy Call Option.
Buy_High_Sell_Low OP 103356508CPC : Thanks for the useful advice, bro. Sometimes, I feel like we are in the scam industry, just like buying crypto coins.
pootpoot : only take trades with high probability. always confirm with weekly 4hr, hourly chart. it's ok to join the bus late once breakout is confirmed only. take precautionary hedging measures when it breaks certain key levels to avoid heavy losses.
104827797 : why u can make lose in Amazon/Microsoft/Apple?
Riding Star : cut loss. pull back your fund. Study, Focus, Target and buy in. Do remember the bottom n Top price. Do not chase after the price.
View more comments...