The Natural Gas concept includes major US-listed companies in the natural gas industry chain.
- 1562.327
- -9.232-0.59%
- 5D
- Daily
- Weekly
- Monthly
- 1Q
- 1Y
News
What happened? Trump's winning percentage plummeted, and "Trump trade" fell across the board......
According to the latest data from the highly anticipated election prediction platform Polymarket, the probability of Trump winning this year's election has now dropped to 54.5%. Keep in mind, just last Friday, Trump's chances of winning were still as high as 63.2%; The sharp drop in Trump's chances of winning is related to a key 'red state' poll released over the weekend: Iowa.
Total Energies CEO Encourages Trump Not to Roll Back Climate Change Regulations: Report
Berkshire Hathaway Reports Decline In Q3 Operating Earnings, Further Reduces Apple Stake
Deal Dispatch: TGI Fridays Goes Bankrupt, BHP Backtracks Comments And More M&A News
usa's two oil & gas giants both saw a decline in net income in Q3, as oil & gas prices remained low and refining margins decreased. | Financial Report View
After strong performances in 2022 and 2023, the performance of oil giants has generally declined this year. The decline is due to the fall in prices of csi commodity equity index oil & gas, as well as the reduced profit margins of converting crude oil product into rbob gasoline and other products, offsetting the performance boost brought by the surge in production.
Chevron Declares $1.63 Dividend
Comments
After 4pm ET the $S&P 500 Index (.SPX.US)$ traded +41 bps, the $Dow Jones Industrial Average (.DJI.US)$ clim...


Gapping up
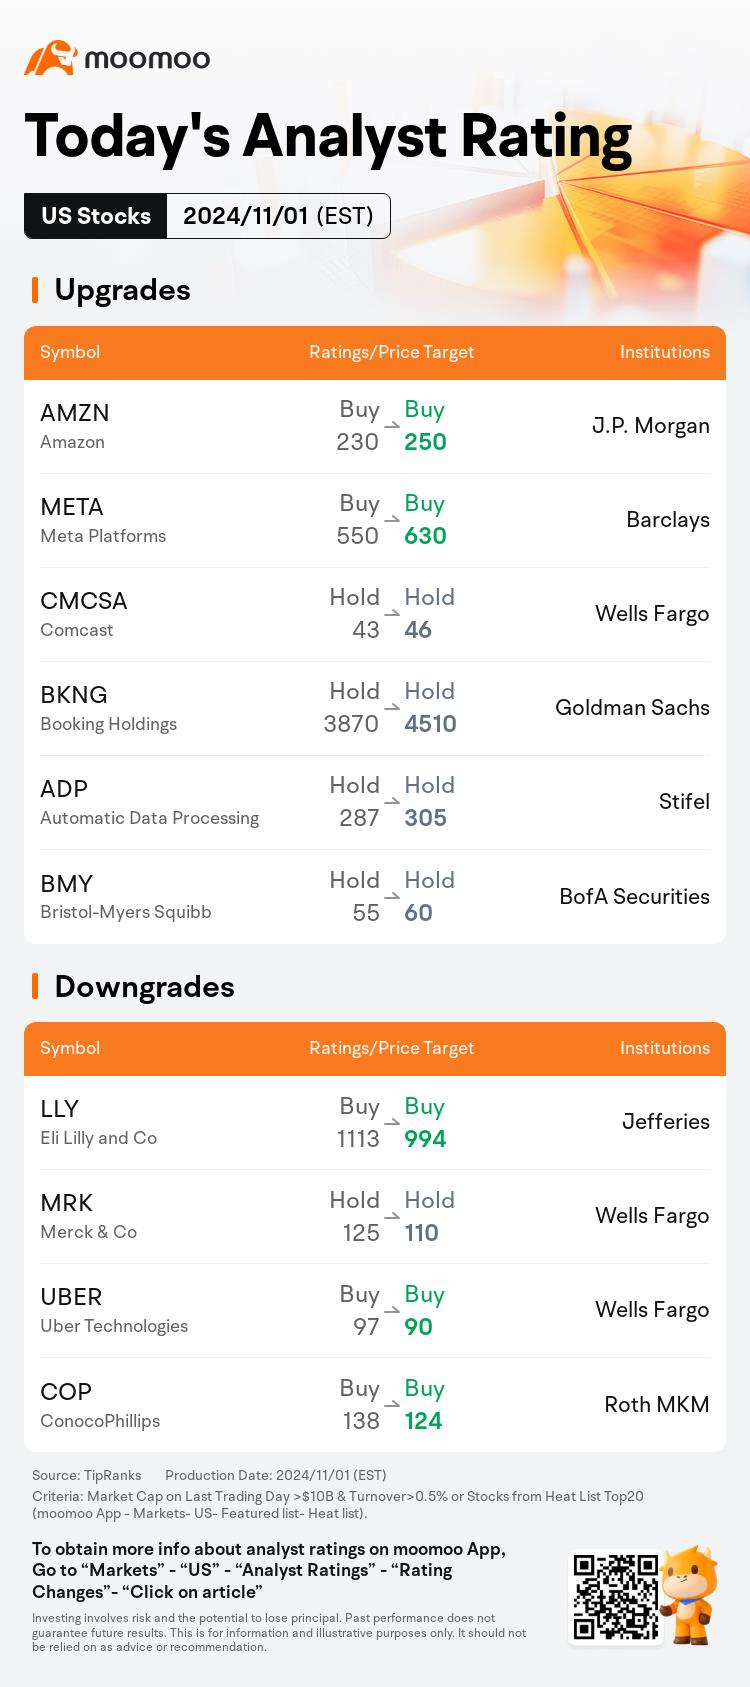
$Amazon (AMZN.US)$ 's shares increased by 7.3% following its earnings report for the third quarter, which exceeded analyst expectations. This occurred despite providing a guidance for the upcoming quarter that fell short of expectations.
$Intel (INTC.US)$ 's shares appreciated by 7.3% as the company showed optimism about the future prospects of its PC and server segments and projected higher revenue...


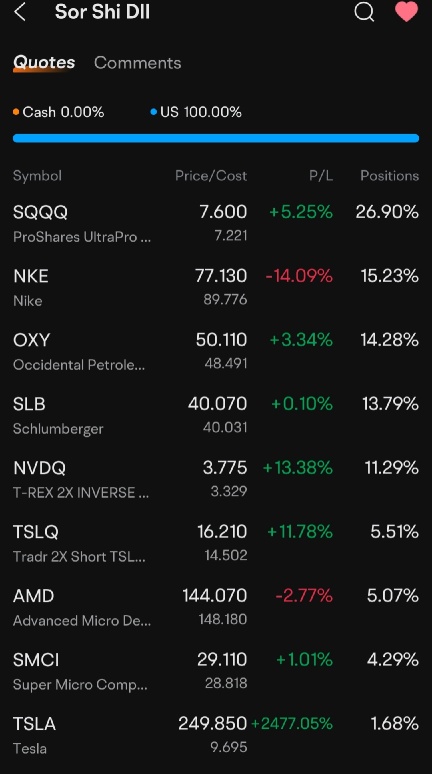
Oxy : Result out on 11 Dec
Seraphicall Oxy : Isn’t it on 12 November? US date format
Oxy Seraphicall : Yes