AXPAmerican Express
270.9202.320+0.86%2.01M543.00M268.600268.600271.390266.250192.60B151.10B710.91M557.74M+1.78%+3.33%+7.62%+13.95%+24.53%+87.26%+45.97%0.96%0.36%20.2224.171.91%Credit Services
CVXChevron
150.9501.250+0.84%8.11M1.22B151.680149.700152.280149.260276.08B257.78B1.83B1.71B+4.85%+4.86%+6.25%-0.22%-4.76%-3.40%+4.50%4.16%0.48%14.9513.292.02%Oil & Gas Integrated
OXYOccidental Petroleum
53.4400.190+0.36%22.80M1.22B54.02053.25054.05052.33048.40B48.23B905.62M902.49M+4.54%+3.27%-1.76%-12.05%-22.23%-9.67%-9.46%1.50%2.53%13.2013.703.23%Oil & Gas E&P
CCitigroup
62.0300.220+0.36%7.38M457.19M61.70061.81062.53061.310118.34B114.51B1.91B1.85B+2.73%+3.56%+1.76%-5.89%+4.06%+62.28%+23.98%3.42%0.40%17.1415.351.97%Banks - Diversified
VRSNVeriSign
187.7600.620+0.33%428.70K80.44M186.450187.140188.380185.76018.33B18.15B97.60M96.65M+2.92%+4.74%+1.55%+7.80%-1.06%-8.19%-8.84%--0.44%22.5123.771.40%Software - Infrastructure
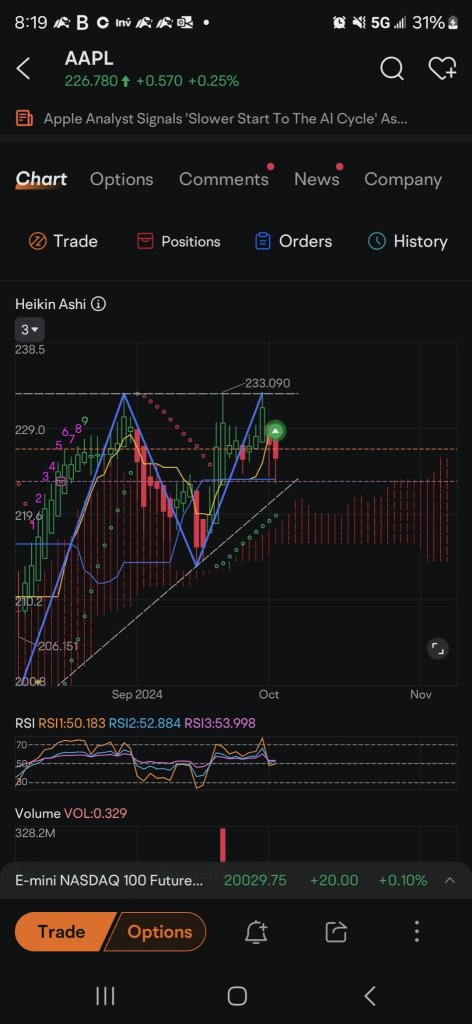
AAPLApple
226.7800.570+0.25%32.88M7.43B225.890226.210227.370223.0203.45T3.44T15.20B15.18B+0.18%+2.76%+2.69%-0.72%+29.89%+31.26%+18.24%0.43%0.22%34.5237.001.92%Consumer Electronics
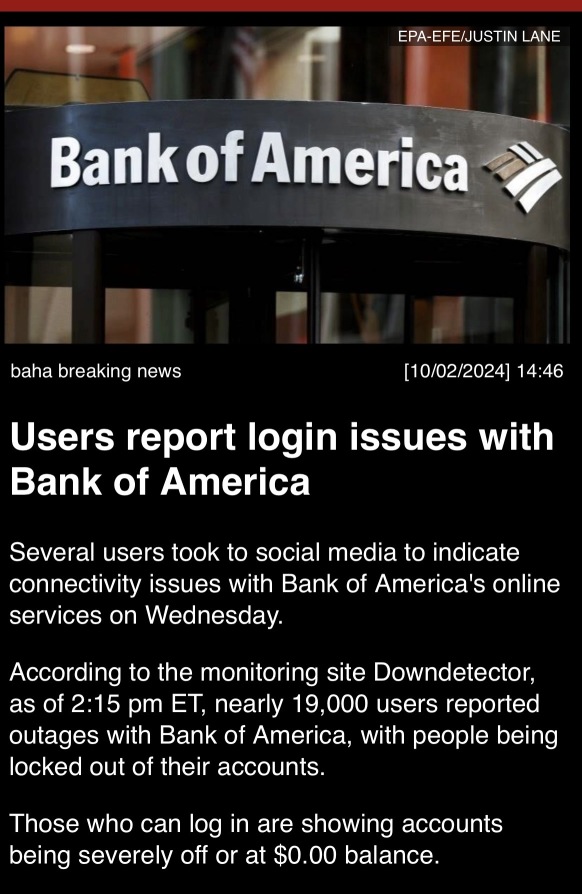
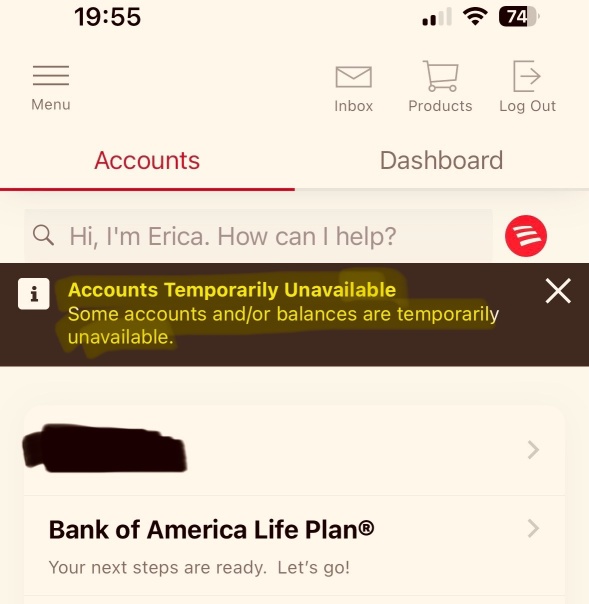
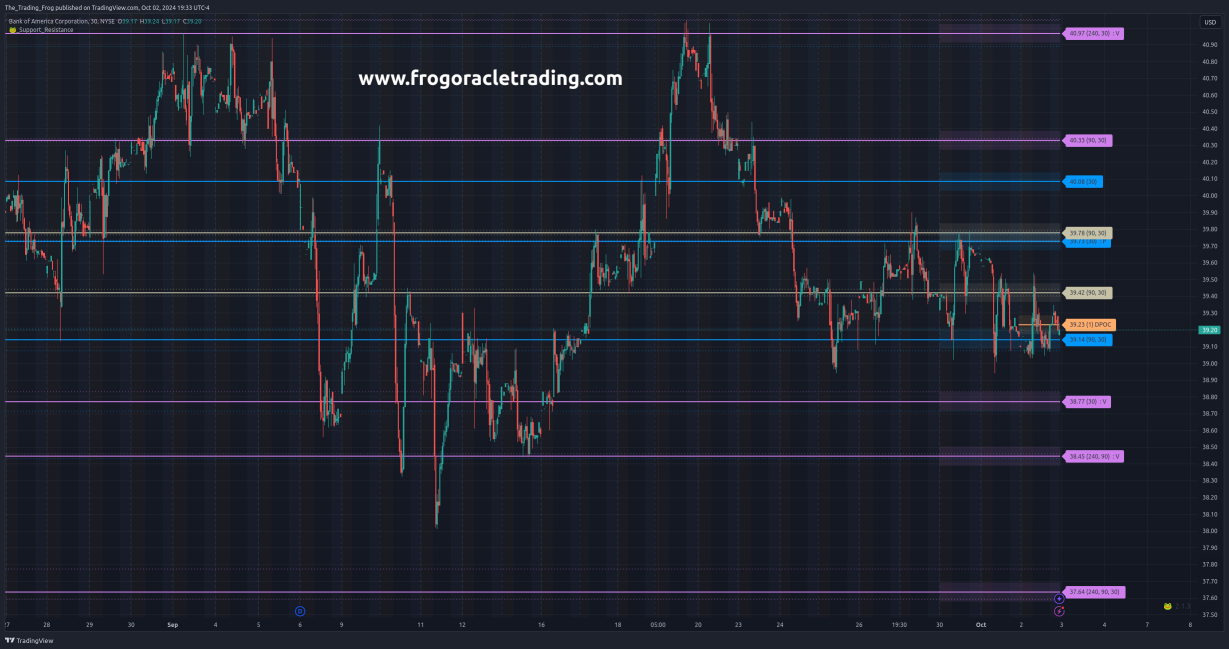
BACBank of America
39.2300.010+0.03%23.30M914.17M39.25039.22039.54039.045304.41B303.36B7.76B7.73B-0.05%-0.98%-2.50%-4.67%+9.29%+55.46%+18.82%2.45%0.30%13.7612.741.26%Banks - Diversified
MAMasterCard
495.570-0.810-0.16%1.74M859.07M492.940496.380495.910489.680457.82B453.68B923.83M915.47M+1.25%+0.16%+2.57%+11.44%+5.98%+26.60%+16.71%0.50%0.19%37.8941.891.26%Credit Services
VVisa
277.000-0.600-0.22%4.74M1.31B276.570277.600277.640275.370547.33B515.71B1.98B1.86B+2.73%-3.98%-1.24%+4.57%+0.87%+20.75%+7.01%0.73%0.26%29.6633.450.82%Credit Services
MCOMoody's
470.190-1.210-0.26%717.56K337.44M472.210471.400474.510468.33085.61B79.23B182.08M168.51M-1.25%-2.99%-2.95%+8.05%+23.07%+50.76%+21.13%0.69%0.43%46.4653.861.31%Financial Data & Stock Exchanges
CBChubb Ltd
291.330-0.790-0.27%1.31M381.36M291.540292.120293.710290.360117.68B109.13B403.93M374.59M+0.34%+0.74%+0.45%+15.36%+19.93%+42.23%+30.20%1.20%0.35%12.3213.361.15%Insurance - Property & Casualty
KOCoca-Cola
71.010-0.700-0.98%11.16M790.73M71.39071.71071.43070.410306.04B275.28B4.31B3.88B-0.62%-1.03%-1.47%+14.05%+22.02%+33.01%+23.25%2.66%0.29%28.8728.751.42%Beverages - Non-Alcoholic
KRThe Kroger
56.090-0.620-1.09%3.87M218.08M56.87056.71057.18556.03040.55B40.18B723.00M716.36M-0.90%+2.69%+5.12%+8.82%+1.04%+27.89%+24.91%2.07%0.54%14.6818.952.04%Grocery Stores
DVADaVita
159.110-3.640-2.24%709.14K113.80M162.550162.750163.060158.93013.35B7.04B83.90M44.23M-3.05%-2.48%+5.11%+15.36%+21.09%+70.83%+51.88%--1.60%16.9321.442.54%Medical Care Facilities
KHCThe Kraft Heinz
34.370-0.800-2.27%8.10M278.34M35.01035.17035.01234.18541.56B30.21B1.21B879.00M-0.43%-2.19%-4.71%+8.88%-3.85%+8.12%-3.80%4.66%0.92%22.0314.882.35%Packaged Foods