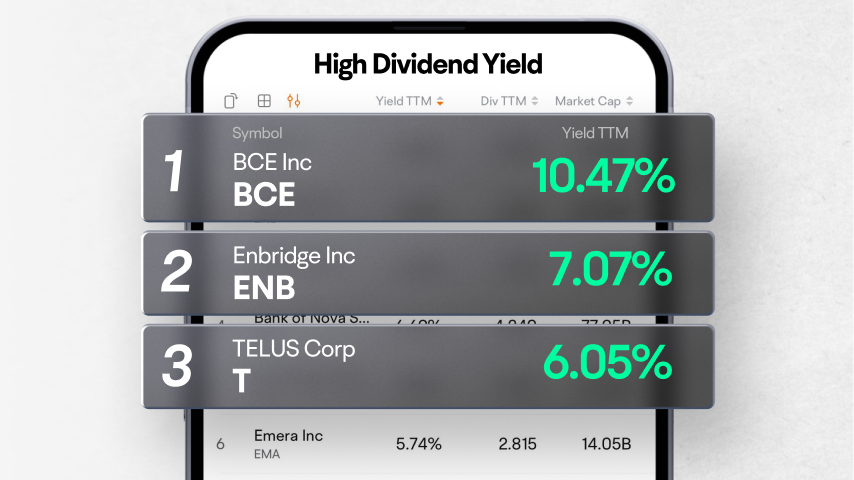
Enbridge Inc
ENB
Choice Properties Real Estate Investment Trust
CHP.UN
Brookfield Renewable Partners LP
BEP.UN
The Toronto-Dominion Bank
TD
TC Energy Corp
TRP
| (Q3)Sep 30, 2024 | (Q2)Jun 30, 2024 | (FY)Dec 31, 2023 | (Q4)Dec 31, 2023 | (FY)Dec 31, 2022 | |
|---|---|---|---|---|---|
| Assets | |||||
| Current assets | |||||
| Cash, cash equivalents and short term investments | --1K | --3.79M | 180.61%275K | --275K | --98K |
| -Cash and cash equivalents | --1K | --3.79M | 180.61%275K | --275K | --98K |
| Other current assets | ---- | ---164K | -52.17%11K | --11K | --23K |
| Total current assets | --1K | --3.62M | 136.36%286K | --286K | --121K |
| Non current assets | |||||
| Net PPE | ---- | --1.41M | 33.74%1.52M | --1.52M | --1.14M |
| -Gross PPE | ---- | --1.41M | 33.85%1.82M | --1.82M | --1.36M |
| -Accumulated depreciation | ---- | ---- | -34.39%-297K | ---297K | ---221K |
| Non current prepaid assets | ---- | --31K | --9K | --9K | --0 |
| Total non current assets | --0 | --1.44M | 34.54%1.53M | --1.53M | --1.14M |
| Total assets | --1K | --5.06M | 44.35%1.81M | --1.81M | --1.26M |
| Liabilities | |||||
| Current liabilities | |||||
| Current debt and capital lease obligation | ---- | --83K | -81.71%15K | --15K | --82K |
| -Current capital lease obligation | ---- | --83K | -81.71%15K | --15K | --82K |
| Payables | ---- | --337K | -12.78%198K | --198K | --227K |
| -accounts payable | ---- | --337K | -47.73%23K | --23K | --44K |
| -Due to related parties current | ---- | ---- | -4.37%175K | --175K | --183K |
| Current accrued expenses | ---- | ---- | -15.33%116K | --116K | --137K |
| Other current liabilities | ---- | --383K | ---- | ---- | ---- |
| Current liabilities | --289K | --803K | -26.23%329K | --329K | --446K |
| Non current liabilities | |||||
| Long term debt and capital lease obligation | ---- | --45K | ---- | ---- | ---- |
| -Long term capital lease obligation | ---- | --45K | ---- | ---- | ---- |
| Non current deferred liabilities | ---- | --322K | 0.99%305K | --305K | --302K |
| Total non current liabilities | --0 | --367K | 0.99%305K | --305K | --302K |
| Total liabilities | --289K | --1.17M | -15.24%634K | --634K | --748K |
| Shareholders'equity | |||||
| Share capital | --187K | --32.07M | 20.58%13.39M | --13.39M | --11.1M |
| -common stock | --187K | --32.07M | 20.58%13.39M | --13.39M | --11.1M |
| Retained earnings | ---475K | ---28.25M | -10.37%-12.27M | ---12.27M | ---11.12M |
| Gains losses not affecting retained earnings | ---- | --74K | -7.46%-72K | ---72K | ---67K |
| Other equity interest | ---- | ---- | -76.90%137K | --137K | --593K |
| Total stockholders'equity | ---288K | --3.89M | 132.09%1.18M | --1.18M | --508K |
| Total equity | ---288K | --3.89M | 132.09%1.18M | --1.18M | --508K |
| Accounting Standards | US-GAAP | US-GAAP | US-GAAP | US-GAAP | US-GAAP |
FY: Financial Year. Refers to the 10-K file disclosed by the listed company to the SEC.
Q: Quarter. Refers to the 10-Q file disclosed by the listed company to the SEC. Q1, Q2, Q3, and Q4 are quarterly reports each with a span of 3 months; Q6 and Q9 are cumulative reports, with Q6 including 6 months and Q9 9 months.
