US ETFDetailed Quotes
ETHU Volatility Shares 2x Ether ETF
- 1.925
- -0.305-13.68%
Close Mar 28 16:00 ET
1.990High1.910Low
1.990High1.910Low32.83MVolume1.980Open2.230Pre Close63.84MTurnover14.83%Turnover Ratio--P/E (Static)221.34MShares15.96452wk High--P/B426.08MFloat Cap1.84252wk Low0.05Dividend TTM221.34MShs Float15.964Historical High2.75%Div YieldTTM3.59%Amplitude1.842Historical Low1.944Avg Price1Lot Size
$Volatility Shares 2x Ether ETF (ETHU.US)$ reverse split incoming
2
$Volatility Shares 2x Ether ETF (ETHU.US)$ just started new position at avg $2.24. let see how ETH perform this year.
1
5
$Volatility Shares 2x Ether ETF (ETHU.US)$ It's always so sad to see my money in the red. But as some say, you have only lost once you sell.
1
1
$Ethereum (ETH.CC)$
March 18, 2025
1️⃣ Part 1 - Complete Technical Analysis of Ethereum
📊1. Multi-Timeframe Analysis (15min, 1h, 4h, Daily)
General Trend & Market Structure
15min: Strong bullish trend with potential exhaustion.
1h: Confirmation of a strong rally with indicators in the overbought zone.
4h: Ongoing bullish recovery, with signs of momentum excess.
Daily: Returning to a bullish phase, key resistance around $1950.
---
2. Volume & Liquidi...


+9
15
14
2
$Volatility Shares 2x Ether ETF (ETHU.US)$ Bitcoin, Ethereum, Dogecoin Match Stock Advances: BTC Should Flip $85,000 And $89,000 Levels For Potential Reversal, Says Analyst
1
$Volatility Shares 2x Ether ETF (ETHU.US)$ WIll this fund have a reverse split before it goes to 0 ?
2
$Ethereum (ETH.CC)$
March 5, 2025:
🔹️Part 1: Context, Trends, and Market Structure
---
1. Multi-Timeframe Analysis and Market Structure
Multi-timeframe analysis is essential to identify underlying trends and avoid false signals. We will analyze ETH across multiple timeframes to detect key levels and the current market dynamics.
a) Monthly Chart (Long-Term)
General Trend: ETH is in a bullish recovery phase after a strong recent correction. Monthl...


+1
20
12
1
$Ethereum (ETH.CC)$
March 4, 2025
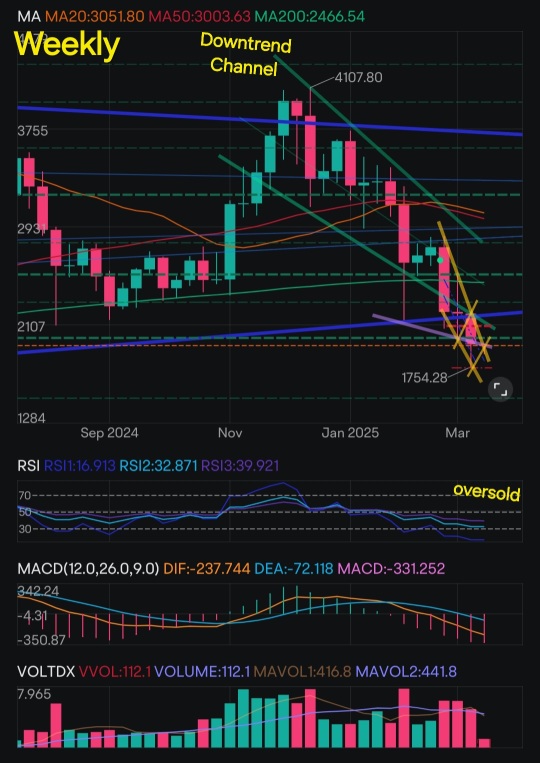
1️⃣ Phase 1: Trend Analysis and Multi-Timeframe Chart Structures
---
1. Weekly Chart Analysis
General Trend:
Main trend: Bearish within a long-term descending channel.
Key Support: $2002 (last tested low).
Key Resistance: $2837 (BBI) and $3152 (VWAP).
Technical Indicators:
RSI: 19.31 (extremely oversold), indicating a potential technical rebound.
MACD: -299.61 (strong negative divergence, but the bearish ...


32
2
1
No comment yet

 just beginner too
 Bitcoin is slow and expensive to use (10 minutes per transaction on average, high fees).

心态 : Will it drop after the split?
Trwils1230 OP 心态 : dunno