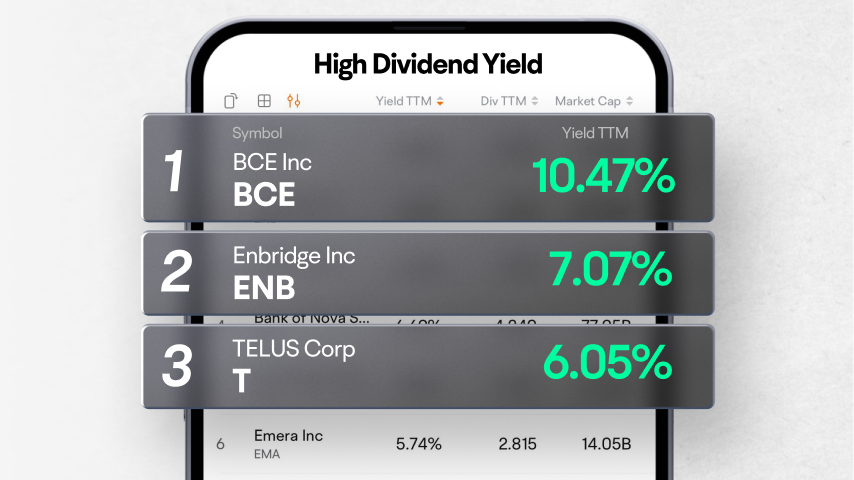
Enbridge Inc
ENB
Power Corporation of Canada
POW
Bank of Nova Scotia
BNS
Emera Inc
EMA
BCE Inc
BCE
| (Q3)Oct 31, 2024 | (Q2)Jul 31, 2024 | (FY)Jan 31, 2024 | (Q4)Jan 31, 2024 | (Q3)Oct 31, 2023 | (Q2)Jul 31, 2023 | (FY)Jan 31, 2023 | |
|---|---|---|---|---|---|---|---|
| Total revenue | 0 | 0 | 0 | 0 | 0 | 0 | 0 |
| Operating revenue | --0 | --0 | --0 | --0 | --0 | --0 | --0 |
| Cost of revenue | |||||||
| Gross profit | |||||||
| Operating expense | 1.97M | 1.03M | 158.67K | 158.67K | 0 | 0 | 0 |
| Selling and administrative expenses | --1.34M | --336.7K | ---- | ---- | --0 | --0 | ---- |
| -Selling and marketing expense | --674.41K | --15K | ---- | ---- | --0 | --0 | ---- |
| -General and administrative expense | --663.81K | --321.7K | ---- | ---- | ---- | ---- | ---- |
| Other operating expenses | --636.39K | --692.15K | --158.67K | ---- | ---- | ---- | ---- |
| Operating profit | -1.97M | -1.03M | -158.67K | -158.67K | 0 | 0 | 0 |
| Net non-operating interest income (expenses) | -6.27K | -84 | -84 | 0 | 0 | ||
| Non-operating interest expense | --6.27K | ---- | ---- | ---- | --0 | ---- | ---- |
| Total other finance cost | ---- | ---- | --84 | ---- | ---- | ---- | ---- |
| Other net income (expenses) | -8.43K | ||||||
| Gain on sale of security | ---8.43K | ---- | ---- | ---- | ---- | ---- | ---- |
| Income before tax | -1.99M | -1.03M | -158.75K | -158.75K | 0 | 0 | 0 |
| Income tax | |||||||
| Earnings from equity interest net of tax | |||||||
| Net income | -1.99M | -1.03M | -158.75K | -158.75K | 0 | 0 | 0 |
| Net income continuous operations | ---1.99M | ---1.03M | ---158.75K | ---158.75K | --0 | --0 | --0 |
| Noncontrolling interests | |||||||
| Net income attributable to the company | -1.99M | -1.03M | -158.75K | -158.75K | 0 | 0 | 0 |
| Preferred stock dividends | |||||||
| Other under preferred stock dividend | |||||||
| Net income attributable to common stockholders | -1.99M | -1.03M | -158.75K | -158.75K | 0 | 0 | 0 |
| Diluted earnings per share | -0.08 | -0.05 | -0.0068 | -0.0068 | 0 | 0 | 0 |
| Basic earnings per share | -0.08 | -0.05 | -0.0068 | -0.0068 | 0 | 0 | 0 |
| Dividend per share | |||||||
| Accounting Standards | US-GAAP | US-GAAP | US-GAAP | US-GAAP | US-GAAP | US-GAAP | US-GAAP |
FY: Financial Year. Refers to the 10-K file disclosed by the listed company to the SEC.
Q: Quarter. Refers to the 10-Q file disclosed by the listed company to the SEC. Q1, Q2, Q3, and Q4 are quarterly reports each with a span of 3 months; Q6 and Q9 are cumulative reports, with Q6 including 6 months and Q9 9 months.
