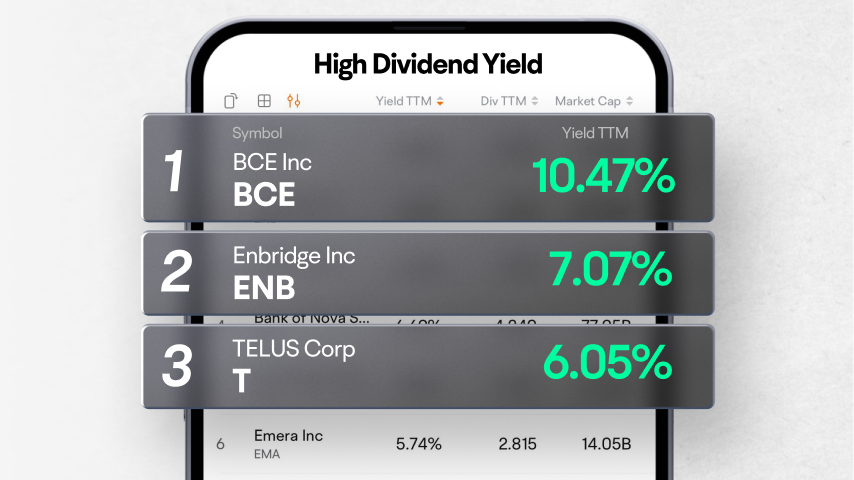
Enbridge Inc
ENB
Choice Properties Real Estate Investment Trust
CHP.UN
Brookfield Renewable Partners LP
BEP.UN
The Toronto-Dominion Bank
TD
TC Energy Corp
TRP
| (Q3)Sep 30, 2024 | (Q2)Jun 30, 2024 | (Q1)Mar 31, 2024 | (FY)Dec 31, 2023 | (Q4)Dec 31, 2023 | (Q3)Sep 30, 2023 | (Q2)Jun 30, 2023 | (Q1)Mar 31, 2023 | (FY)Dec 31, 2022 | (Q4)Dec 31, 2022 | |
|---|---|---|---|---|---|---|---|---|---|---|
| Total revenue | -23.62%7.16M | -37.12%6.48M | -54.44%5.07M | -52.83%37.86M | -58.08%7.06M | -65.62%9.38M | -58.55%10.31M | -1.58%11.13M | 189.69%80.27M | 55.17%16.84M |
| Operating revenue | -23.62%7.16M | -37.12%6.48M | -54.44%5.07M | -52.83%37.86M | -58.08%7.06M | -65.62%9.38M | -58.55%10.31M | -1.58%11.13M | 189.69%80.27M | 55.17%16.84M |
| Cost of revenue | -16.07%2.57M | -9.33%2.56M | -29.27%2.53M | -26.94%13.17M | 38.29%5.49M | -49.65%3.06M | -47.13%2.82M | 34.66%3.57M | 152.73%18.02M | 47.42%3.97M |
| Gross profit | -27.27%4.6M | -47.58%3.92M | -66.36%2.54M | -60.33%24.7M | -87.79%1.57M | -70.19%6.32M | -61.67%7.49M | -12.71%7.55M | 202.50%62.25M | 57.72%12.87M |
| Operating expense | -32.84%5.49M | -19.60%4.99M | -9.43%5.91M | -30.96%26.83M | -64.85%4.16M | -37.72%8.18M | -29.80%6.21M | 28.82%6.52M | 147.17%38.86M | 105.76%11.83M |
| Selling and administrative expenses | -32.84%5.49M | -19.60%4.99M | -9.43%5.91M | -36.23%24.63M | -83.12%1.96M | -37.72%8.18M | -29.80%6.21M | 28.82%6.52M | 145.65%38.62M | 101.60%11.59M |
| -Selling and marketing expense | -23.60%3.53M | -14.01%4.17M | -62.20%1.92M | -48.02%15.73M | -83.37%1.19M | -58.26%4.61M | -40.23%4.85M | 29.08%5.07M | 168.84%30.25M | 60.32%7.16M |
| -General and administrative expense | -44.81%1.97M | -39.53%823K | 175.60%3.99M | 6.35%8.91M | -82.73%766K | 71.75%3.56M | 85.68%1.36M | 27.94%1.45M | 87.27%8.37M | 244.87%4.44M |
| Research and development costs | ---- | ---- | ---- | 861.54%125K | ---- | ---- | ---- | ---- | --13K | ---- |
| Depreciation amortization depletion | ---- | ---- | ---- | 32.04%239K | ---- | ---- | ---- | ---- | --181K | ---- |
| -Depreciation and amortization | ---- | ---- | ---- | 32.04%239K | ---- | ---- | ---- | ---- | --181K | ---- |
| Provision for doubtful accounts | ---- | ---- | ---- | 19,388.89%1.75M | ---- | ---- | ---- | ---- | --9K | ---- |
| Other operating expenses | ---- | ---- | ---- | 133.33%84K | ---- | ---- | ---- | ---- | --36K | ---- |
| Operating profit | 51.80%-895K | -183.49%-1.07M | -426.80%-3.37M | -109.13%-2.14M | -348.41%-2.59M | -123.00%-1.86M | -88.04%1.28M | -71.29%1.03M | 381.71%23.39M | -56.82%1.04M |
| Net non-operating interest income (expenses) | 10.17%-1.43M | -64.46%-1.56M | -32.15%-1.38M | -115.14%-6.39M | -54.29%-2.81M | -120.64%-1.59M | -288.16%-951K | -463.24%-1.04M | -619.61%-2.97M | -889.13%-1.82M |
| Non-operating interest income | -83.67%32K | -37.38%129K | 264.10%284K | 144.81%661K | 115.48%181K | 164.86%196K | 255.17%206K | 47.17%78K | 513.64%270K | 660.00%84K |
| Non-operating interest expense | -18.22%1.46M | 46.33%1.69M | 48.30%1.66M | 110.86%6.84M | 45.48%2.77M | 124.75%1.79M | 281.85%1.16M | 370.59%1.12M | 609.41%3.24M | 1,026.63%1.9M |
| Total other finance cost | ---- | ---- | ---- | --219K | ---- | ---- | ---- | ---- | ---- | ---- |
| Other net income (expenses) | -612.50%-41K | -27.27%8K | ||||||||
| Gain on sale of security | ---- | ---- | ---- | 62.50%13K | ---- | ---- | ---- | ---- | -27.27%8K | ---- |
| Special income (charges) | ---- | ---- | ---- | ---54K | ---- | ---- | ---- | ---- | --0 | ---- |
| -Gain on sale of property,plant,equipment | ---- | ---- | ---- | ---54K | ---- | ---- | ---- | ---- | --0 | ---- |
| Income before tax | 32.58%-2.33M | -904.59%-2.63M | -39,425.00%-4.74M | -141.96%-8.57M | -604.93%-5.44M | -146.93%-3.45M | -96.87%327K | -100.35%-12K | 358.63%20.42M | -134.45%-771K |
| Income tax | -28.57%10K | -90.70%8K | -90.63%9K | -198.93%-2.59M | -616.11%-2.79M | -98.43%14K | -89.46%86K | -74.05%96K | 181.31%2.62M | 50.00%540K |
| Earnings from equity interest net of tax | ||||||||||
| Net income | 32.56%-2.34M | -1,195.02%-2.64M | -4,300.00%-4.75M | -133.58%-5.98M | -101.98%-2.65M | -153.64%-3.46M | -97.50%241K | -103.56%-108K | 405.51%17.8M | -169.81%-1.31M |
| Net income continuous operations | 32.56%-2.34M | -1,195.02%-2.64M | -4,300.00%-4.75M | -133.58%-5.98M | -101.98%-2.65M | -153.64%-3.46M | -97.50%241K | -103.56%-108K | 405.51%17.8M | -169.81%-1.31M |
| Noncontrolling interests | ||||||||||
| Net income attributable to the company | 32.56%-2.34M | -1,195.02%-2.64M | -4,300.00%-4.75M | -133.58%-5.98M | -101.98%-2.65M | -153.64%-3.46M | -97.50%241K | -103.56%-108K | 405.51%17.8M | -169.81%-1.31M |
| Preferred stock dividends | ||||||||||
| Other under preferred stock dividend | ||||||||||
| Net income attributable to common stockholders | 32.56%-2.34M | -1,195.02%-2.64M | -4,300.00%-4.75M | -133.58%-5.98M | -101.98%-2.65M | -153.64%-3.46M | -97.50%241K | -103.56%-108K | 405.51%17.8M | -169.81%-1.31M |
| Diluted earnings per share | 33.33%-0.044 | -1,766.67%-0.05 | -4,400.00%-0.09 | -133.14%-0.114 | -82.14%-0.051 | -153.66%-0.066 | -98.41%0.003 | -103.33%-0.002 | 391.43%0.344 | -175.68%-0.028 |
| Basic earnings per share | 33.33%-0.044 | -1,766.67%-0.05 | -4,400.00%-0.09 | -133.93%-0.114 | -82.14%-0.051 | -154.55%-0.066 | -98.41%0.003 | -103.51%-0.002 | 394.12%0.336 | -177.78%-0.028 |
| Dividend per share | ||||||||||
| Accounting Standards | US-GAAP | US-GAAP | US-GAAP | US-GAAP | US-GAAP | US-GAAP | US-GAAP | US-GAAP | US-GAAP | US-GAAP |
| Audit Opinions | -- | -- | -- | -- | -- | -- | -- | -- | Unqualified Opinion | -- |
FY: Financial Year. Refers to the 10-K file disclosed by the listed company to the SEC.
Q: Quarter. Refers to the 10-Q file disclosed by the listed company to the SEC. Q1, Q2, Q3, and Q4 are quarterly reports each with a span of 3 months; Q6 and Q9 are cumulative reports, with Q6 including 6 months and Q9 9 months.
