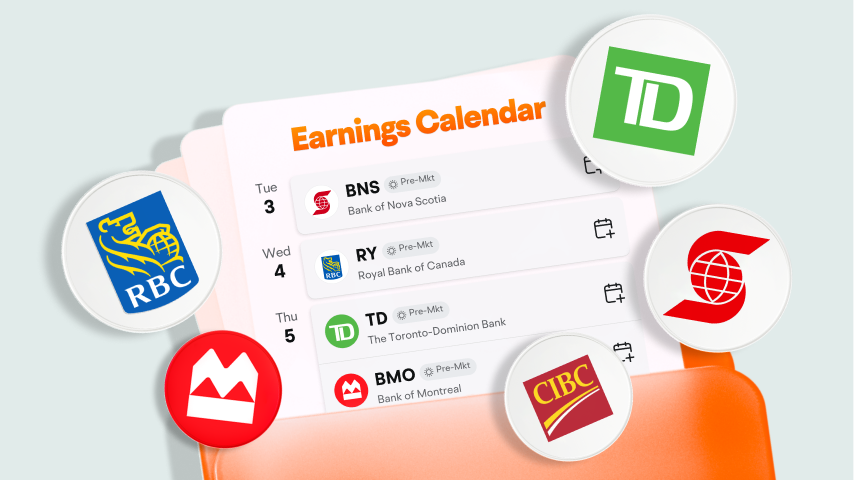
Bank of Nova Scotia
BNS
Bank of Montreal
BMO
The Toronto-Dominion Bank
TD
Canadian Imperial Bank of Commerce
CM
Royal Bank of Canada
RY
| (Q1)Aug 31, 2024 | (FY)May 31, 2024 | (Q4)May 31, 2024 | (Q3)Feb 29, 2024 | (FY)May 31, 2023 | (Q4)May 31, 2023 | |
|---|---|---|---|---|---|---|
| Assets | ||||||
| Current assets | ||||||
| Cash, cash equivalents and short term investments | --405.33K | 732.12%474.19K | 732.12%474.19K | --421.57K | --56.99K | --56.99K |
| -Cash and cash equivalents | --405.33K | 732.12%474.19K | 732.12%474.19K | --421.57K | --56.99K | --56.99K |
| Receivables | --12.35K | 5,901.12%10.68K | 5,901.12%10.68K | --8.65K | --178 | --178 |
| -Accounts receivable | --12.35K | 5,901.12%10.68K | 5,901.12%10.68K | --8.65K | --178 | --178 |
| Prepaid assets | --10.82K | --5K | --5K | ---- | --0 | --0 |
| Current deferred assets | --30.76K | --11.09K | --11.09K | ---- | --0 | --0 |
| Total current assets | --459.26K | 776.36%500.96K | 776.36%500.96K | --430.22K | --57.16K | --57.16K |
| Non current assets | ||||||
| Total non current assets | --0 | --0 | --0 | --0 | --0 | --0 |
| Total assets | --459.26K | 776.36%500.96K | 776.36%500.96K | --430.22K | --57.16K | --57.16K |
| Liabilities | ||||||
| Current liabilities | ||||||
| Current liabilities | --35.27K | 699.31%35.89K | 699.31%35.89K | --143.14K | --4.49K | --4.49K |
| Non current liabilities | ||||||
| Total non current liabilities | --0 | --0 | --0 | --0 | --0 | --0 |
| Total liabilities | --35.27K | 699.31%35.89K | 699.31%35.89K | --143.14K | --4.49K | --4.49K |
| Shareholders'equity | ||||||
| Share capital | --429.24K | 5,623.19%429.24K | 5,623.19%429.24K | --429.24K | --7.5K | --7.5K |
| -common stock | --429.24K | 5,623.19%429.24K | 5,623.19%429.24K | --429.24K | --7.5K | --7.5K |
| Retained earnings | ---258.55K | -4,406.17%-217.47K | -4,406.17%-217.47K | ---180.06K | ---4.83K | ---4.83K |
| Gains losses not affecting retained earnings | --93K | ---- | ---- | ---- | ---- | ---- |
| Other equity interest | --160.3K | 406.60%253.3K | 406.60%253.3K | --37.9K | --50K | --50K |
| Total stockholders'equity | --423.99K | 782.92%465.07K | 782.92%465.07K | --287.08K | --52.67K | --52.67K |
| Total equity | --423.99K | 782.92%465.07K | 782.92%465.07K | --287.08K | --52.67K | --52.67K |
| Accounting Standards | US-GAAP | US-GAAP | US-GAAP | US-GAAP | US-GAAP | US-GAAP |
FY: Financial Year. Refers to the 10-K file disclosed by the listed company to the SEC.
Q: Quarter. Refers to the 10-Q file disclosed by the listed company to the SEC. Q1, Q2, Q3, and Q4 are quarterly reports each with a span of 3 months; Q6 and Q9 are cumulative reports, with Q6 including 6 months and Q9 9 months.
