No Data
US OptionsDetailed Quotes
SMCX241220P15000
- 1.25
- 0.000.00%
15min DelayClose Nov 22 16:00 ET
0.00High0.00Low
1.25Open1.25Pre Close0 Volume10 Open Interest15.00Strike Price0.00Turnover381.64%IV74.79%PremiumDec 20, 2024Expiry Date0.00Intrinsic Value100Multiplier25DDays to Expiry1.25Extrinsic Value100Contract SizeAmericanOptions Type-0.0370Delta0.0015Gamma43.64Leverage Ratio-0.0865Theta-0.0020Rho-1.61Eff Leverage0.0117Vega
Intraday
- 5D
- Daily
News
Comments
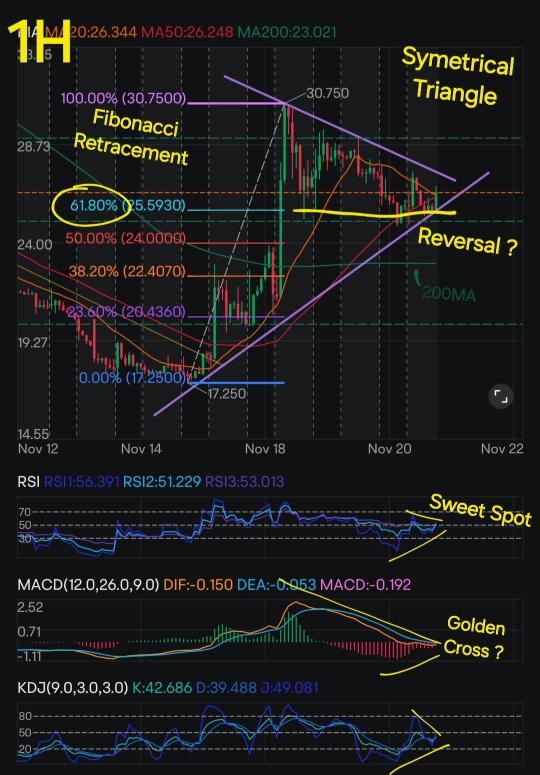
$Super Micro Computer (SMCI.US)$ A nice Symmetrical Triangle as we like them. The only negative thing I see here is the "death cross" with the 20 and the 50MA, which could lower the stock price towards 23-24$, near the 200MA or the previous fibonacci level... But remember here that when it's "meme stock" or stock like that, Technical Analysis works less than with "normal stock".
$Defiance Daily Target 2X Long SMCI ETF (SMCX.US)$
$Defiance Daily Target 2X Long SMCI ETF (SMCX.US)$

6
5
$Symbotic (SYM.US)$ $S&W Seed (SANW.US)$ $Vroom (VRM.US)$ $Dogwood Therapeutics (DWTX.US)$ $Interactive Strength (TRNR.US)$ $Syros Pharmaceuticals (SYRS.US)$ $SmartKem (SMTK.US)$ $Next Technology (NXTT.US)$ $Aclaris Therapeutics (ACRS.US)$ $Defiance Daily Target 2X Long SMCI ETF (SMCX.US)$ $noco-noco (NCNC.US)$ $Volato Group (SOAR.US)$ $PainReform (PRFX.US)$

5
$Defiance Daily Target 2X Long SMCI ETF (SMCX.US) Where to check the information about the reverse split?
1
Read more


XSpace : SMCI has shown a strong rebound from the key support level of 17.25, with rising momentum backed by bullish indicators such as a KDJ crossover, upward-moving averages, and expanding Bollinger Bands. The surge in trading volume reflects growing investor confidence, positioning the stock for a potential breakout above 29.50.
Mrstocksplitsundae : this is hilarious... using charts that's cute....but completely irrelevant.....thanks for the joke of the day... ..
GorakhNGupta : Dude, Fundamental don't work in adverse situation, 20,50,200 MA will never be able to predict the next move for SMCI situation
Kevin Matte OP : lolllll
Mrstocksplitsundae : time to sell boys...50%up I'm going christmas shopping ... have fun risking those profits...